$SPONGE (SPONGE/USD): Is the Bottom In? A Potential Rebound Play
Estimated Reading Time: 2 minutes
Don’t invest unless you’re prepared to lose all the money you invest. This is a high-risk investment and you are unlikely to be protected if something goes wrong. Take 2 minutes to learn more

After a steep plunge from its $0.0007 peak, the SPONGE/USD market may have found a foothold. The descent has stalled near the $0.000013 support level, where the chart has printed a telling cluster of four Doji candlesticks. This classic pattern often signals that the bearish exhaustion is setting in and a reversal could be brewing.
This price action hints that strategic accumulation is likely underway, positioning $SPONGE for a potential bounce. All eyes are now on whether buyers can muster the strength to ignite a recovery from this key support zone.
Levels to Watch:
-
Resistance: $0.000115, $0.000120, $0.000130
-
Support: $0.000010, $0.000009, $0.000008
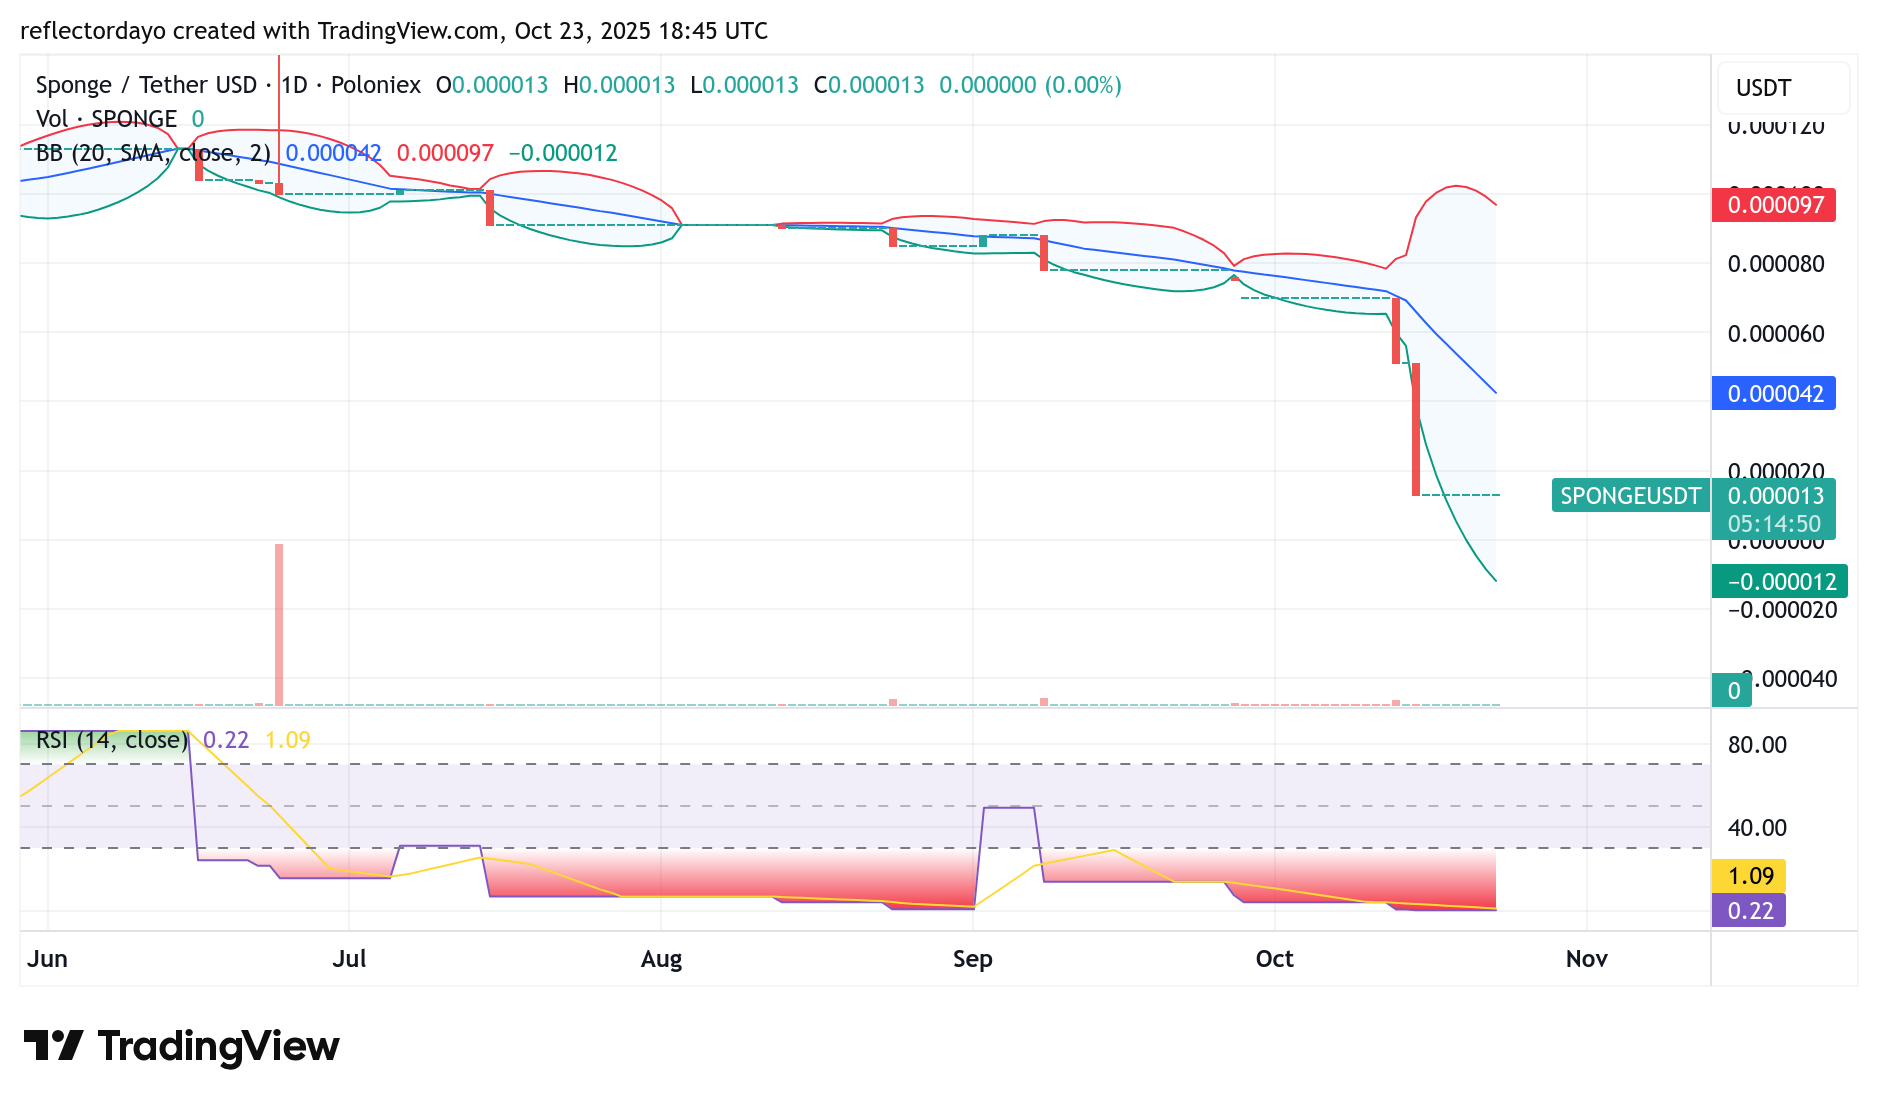
SPONGE/USD Daily Chart: Oversold and Primed for Action
The Bollinger Bands have blown out to an extreme width, underscoring the intense volatility. Crucially, the SPONGE/USD price has been trading below the lower band—a strong technical indication that the market is oversold. This is corroborated by the RSI, which is flashing a clear exhaustion signal. Together, these factors create a compelling setup where the risk of a sharp upward snap is elevated.
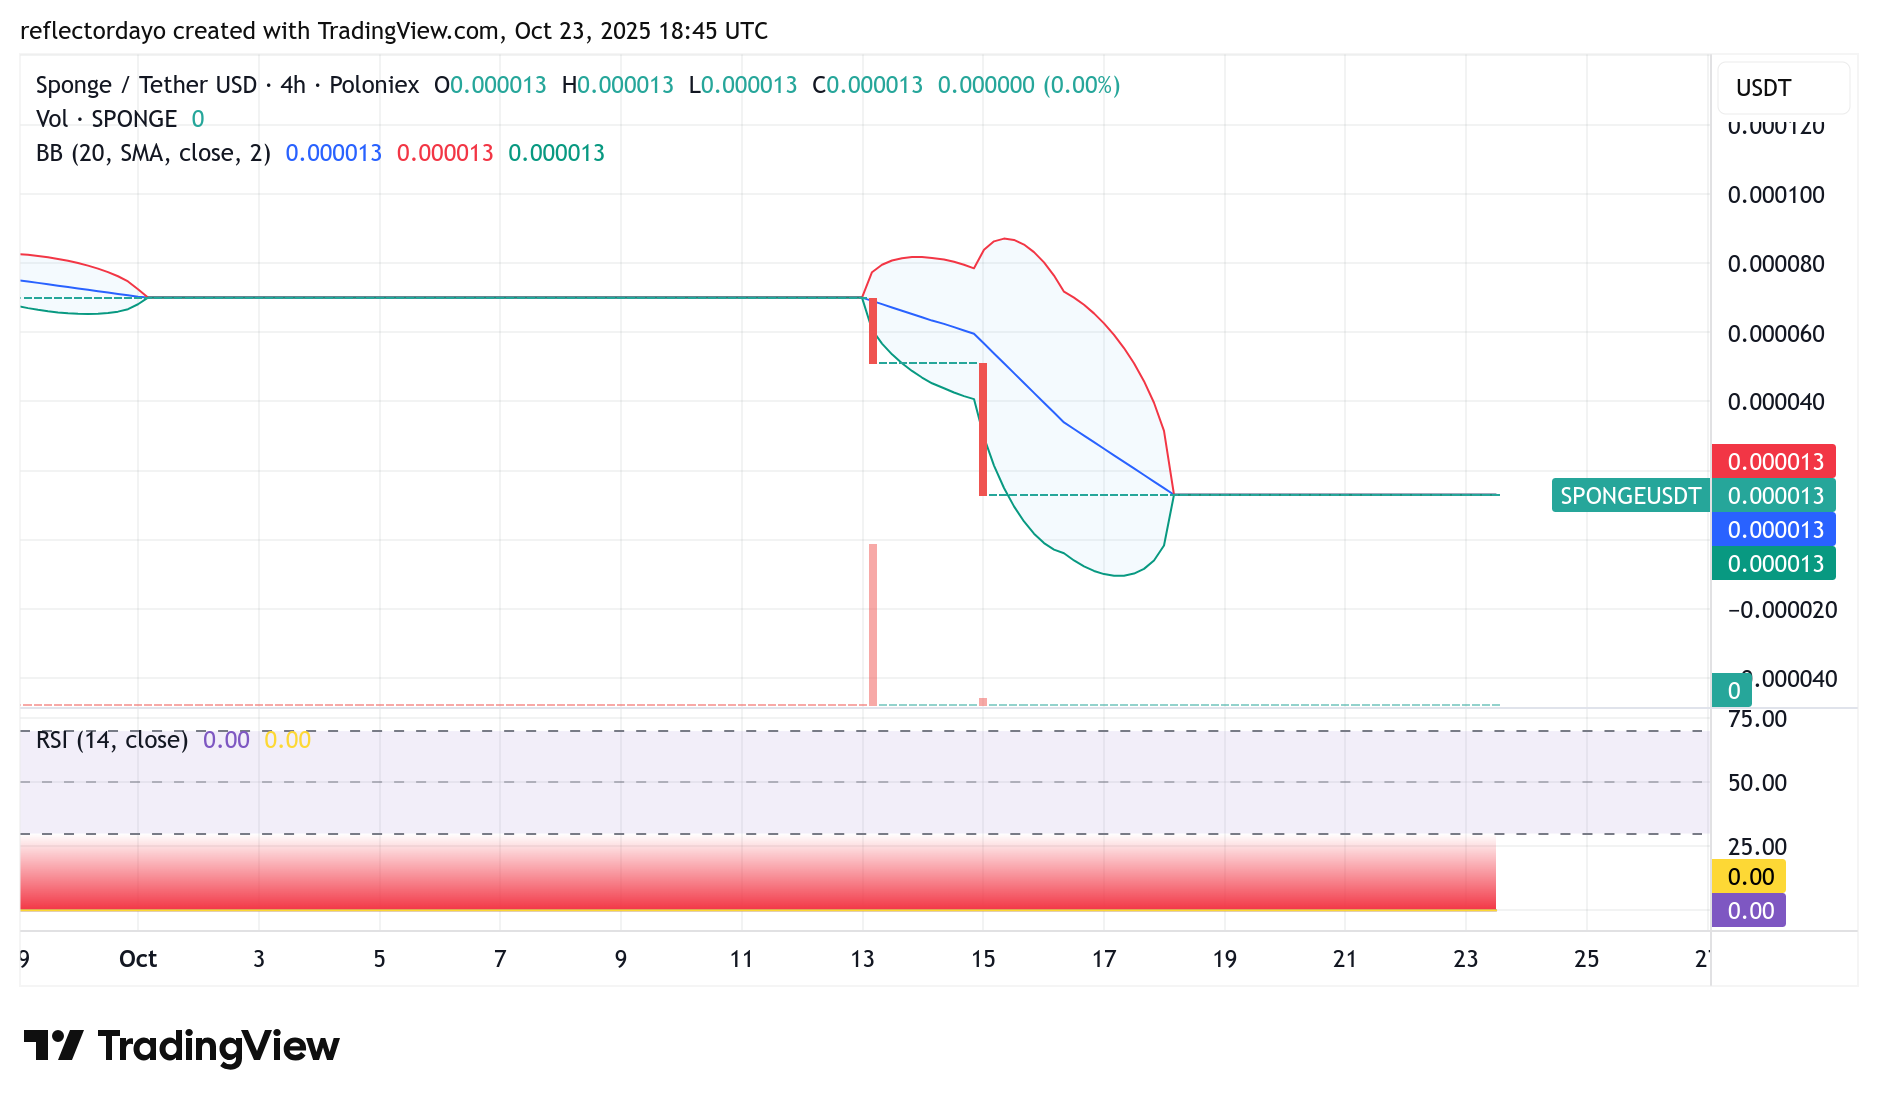
$SPONGE 4-Hour Chart: Mapping the Recovery Path
Should a rebound take hold, the first significant target for the bulls lies near $0.00006. Given the pent-up energy from the preceding sell-off, any return of buying pressure could trigger a rapid, volatile move upward. Traders should monitor this setup closely, as these volatility squeezes can create powerful short-term opportunities.
Buy $SPONGE!
JEETS OUT pic.twitter.com/7r2IPOBHhx
— $SPONGE (@spongeoneth) October 15, 2025
Join the SPONGE community and get in on the next big crypto opportunity! Buy Sponge ($SPONGE) today