$SPONGE (SPONGE/USD) Price Makes a Comeback: Can the Rally Hold?
Estimated Reading Time: 2 minutes
Don’t invest unless you’re prepared to lose all the money you invest. This is a high-risk investment and you are unlikely to be protected if something goes wrong. Take 2 minutes to learn more

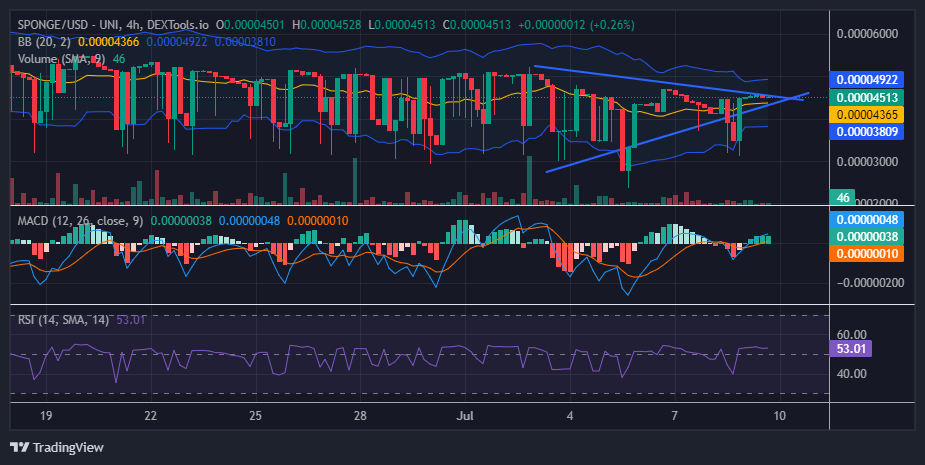
The $SPONGE market has rebounded from below the $0.00004 price level, rallying to the $0.000045 price level, which is currently acting as near-term resistance. In the previous analysis of the SPONGE crypto signal, it was noted that both bulls and bears were targeting the $0.00004 price level, resulting in a convergence of support and resistance around this level. It is worth noting that the $0.00004 price level has acted as bullish support for a significant period. Despite this, the bearish market has tested this level multiple times, but the bulls have consistently demonstrated their resilience. The recent launch point for the market was the $0.000035 price level, facilitating the recovery to the $0.000045 price level.
Key Market Dynamics:
- Resistance Levels: $0.0010, $0.0011, and $0.0012
- Support Levels: $0.000035, $0.000030, and $0.000025
SPONGE/USD Technical Outlook
The SPONGE/USD market has rebounded from below the $0.00004 price level, rallying to $0.000045, which is currently acting as near-term resistance. In the previous analysis of the $SPONGE market, it was noted that both bulls and bears were targeting the $0.00004 price level, resulting in a convergence of support and resistance around this level. The $0.00004 price level has served as bullish support for a significant period. Despite repeated tests by the bearish market, the bulls have consistently demonstrated their resilience. The recent launch point for the market was $0.000035, facilitating the recovery to $0.000045.
$SPONGE (SPONGE/USD) 1-Hour Chart Insights
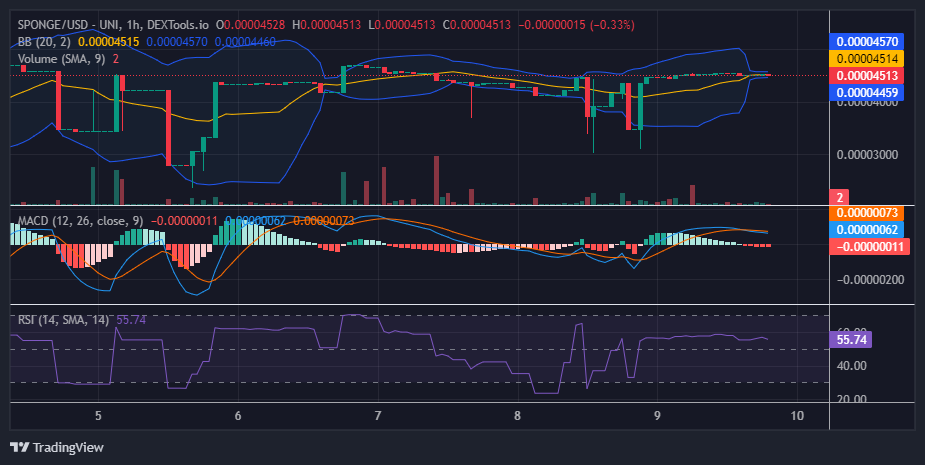
From the perspective of the 1-hour chart, the $SPONGE market is consolidating at the $0.000045 price level, with the Bollinger Bands converging around the price action to form a very narrow price channel. This volatility squeeze typically precedes a clear directional movement in the price. However, the trade volume histograms are currently quite low, indicating a lack of buying interest and indecision at this level.
Buy SPONGE/USD!
Say it back 🧽💛 pic.twitter.com/6LF18Q1M82
— $SPONGE (@spongeoneth) July 8, 2024
Invest in the hottest and best meme coin. Buy Sponge ($SPONGE) today!