$SPONGE (SPONGE/USD) Price Stalemate: Bulls Dig In, Bears Circle
Estimated Reading Time: 3 minutes
Don’t invest unless you’re prepared to lose all the money you invest. This is a high-risk investment and you are unlikely to be protected if something goes wrong. Take 2 minutes to learn more

In the most recent analysis of the $SPONGE market, we observed that the bearish side is attempting to extend their influence from the $0.000055 price level to around $0.000050, as bulls struggled at the $0.000050 price level in yesterday’s market. Initially, the bulls faced resistance at $0.000055, but this barrier has since dipped slightly to $0.000051. While this might dampen their spirits, today’s trading activities, as shown on the 4-hour chart, present hope as the bulls are now gradually pushing through the resistance at $0.000050.
Key Market Dynamics:
- Resistance Levels: $0.0010, $0.0011, and $0.0012
- Support Levels: $0.000035, $0.000030, and $0.000025

SPONGE/USD Show Hidden Strength Despite Sideways Market
Yesterday, it was noted that, despite the bears managing to push the resistance level lower from $0.000055 to $0.000050, a bullish divergence was observed between the Moving Average Convergence and Divergence (MACD) histograms and the actual price action on the 4-hour chart. As speculated, the price action has gained some height, though marginally, with the price currently standing at $0.0000504. The price action of the $SPONGE is still trending upward; however, the $0.000055 price level remains a formidable resistance. Despite this, the bulls have continuously demonstrated resilience.
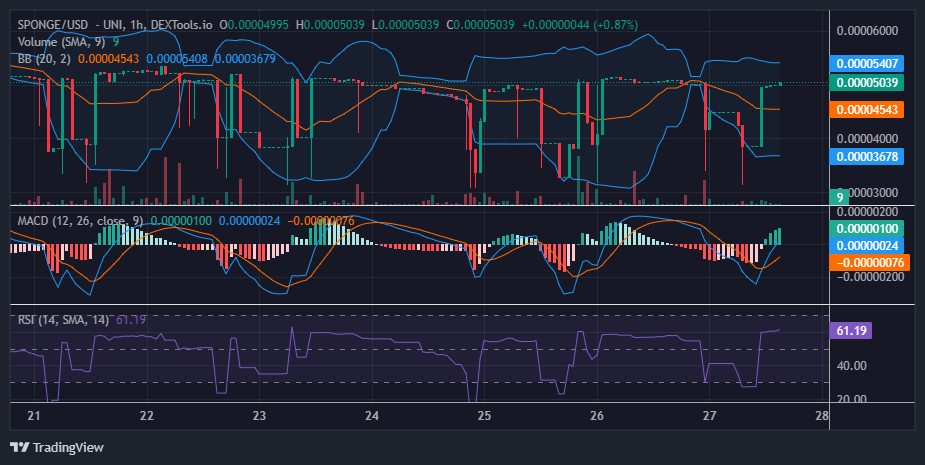
$SPONGE (SPONGE/USD) 1-Hour Chart Insights
After the volatility squeeze in yesterday’s market, the price action experienced a breakdown. The bulls were knocked down again in this territory. However, demonstrating their resilience, the price action has bounced back to this level, putting pressure on the bears at $0.000050. The bullish trend in the current 1-hour trading session is ongoing. Comparing the candlestick of the last session with the volume of trade histogram for the same period, we see that the candlestick is quite small. This indicates the presence of a bearish bias at this level, as traders seem undecided. Buyers need to maintain pressure at this level, and it may eventually give way.
Buy SPONGE/USD
History teachers in 2050 be like:$SPONGE was inevitable 🧽🚀 pic.twitter.com/3zQJZFwRm2
— $SPONGE (@spongeoneth) June 24, 2024
Invest in the hottest and best meme coin. Buy Sponge ($SPONGE) today!