SPONGE/USD ($SPONGE) Holds Firm at $0.0001 Support, Poised for Potential Upside
Estimated Reading Time: 2 minutes
Don’t invest unless you’re prepared to lose all the money you invest. This is a high-risk investment and you are unlikely to be protected if something goes wrong. Take 2 minutes to learn more

The $SPONGE market remains in consolidation around the $0.000101 level, signaling a potential bullish breakout. After a sharp decline from approximately $0.000108, the price found support at $0.0001, where it has continued to move sideways. Now, with indicators hinting at a possible reversal, the market could be gearing up for a rally toward $0.00011, with the immediate hurdle at $0.000108 in sight.
Key Levels to Watch
-
Resistance: $0.000110, $0.00012, $0.00013
-
Support: $0.000090, $0.0000850, $0.00008
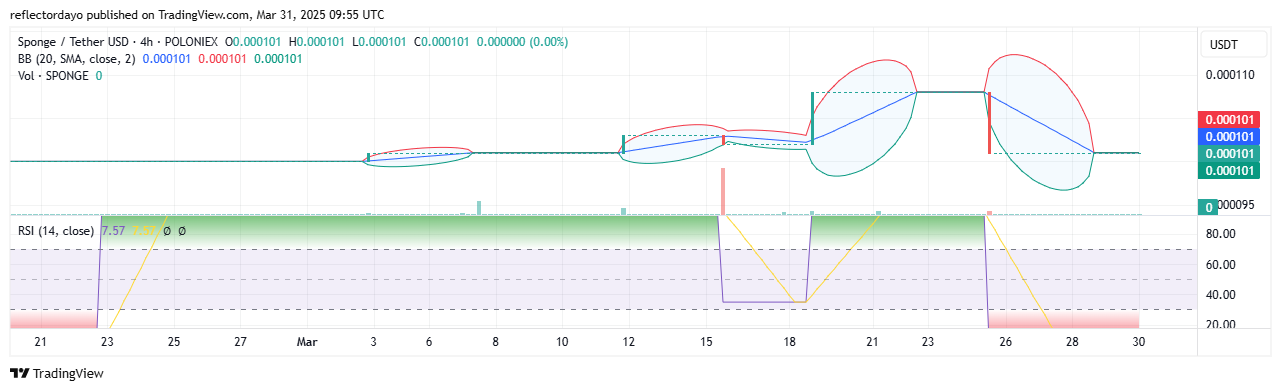
SPONGE/USD Market Analysis: Technical Outlook
The trading volume indicator suggests limited activity, with buyers and sellers locked in a standoff at the $0.0001 level. However, the tightening Bollinger Bands indicate a period of low volatility, often a precursor to a significant price move. Since this support level aligns with the bullish zone, a $SPONGE breakout to the upside remains a strong possibility.
Meanwhile, the Relative Strength Index (RSI) continues to signal oversold conditions after the recent bearish downturn. This increases the likelihood of a recovery toward $0.00011. However, for the bullish momentum to sustain a breakout from the $0.0001–$0.00011 range, buyers must build strength near the $0.00011 resistance level.
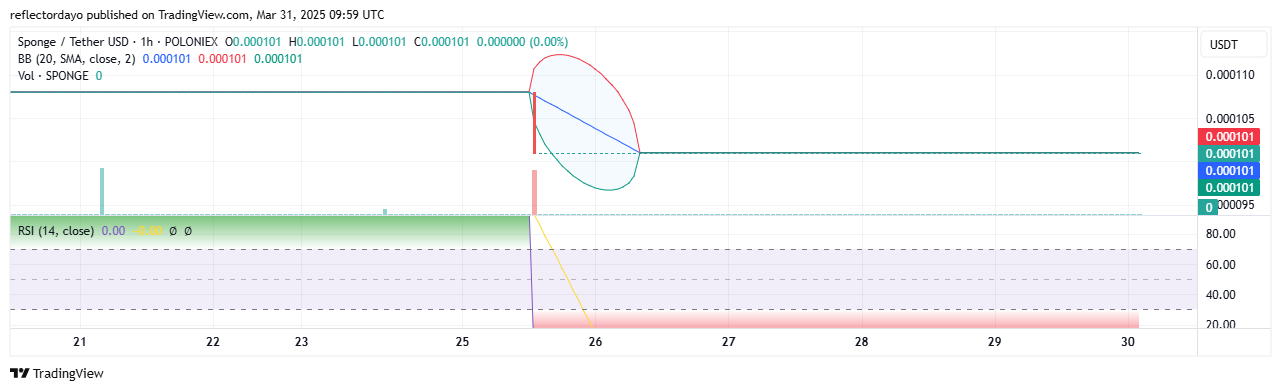
SPONGE/USD 1-Hour Chart: Breakout on the Horizon?
On the 1-hour chart, the Bollinger Bands are narrowing, reinforcing the ongoing price consolidation and hinting at an impending volatility surge. Historically, such contractions precede decisive breakouts, making the current setup one to watch closely. Additionally, the RSI remains deeply in oversold territory, supporting the case for a bullish reversal. With firm support at $0.0001 and signs of growing buying pressure, a rebound appears to be the most probable outcome in the short term.
Buy $SPONGE!
The mind of an average crypto trader pic.twitter.com/87N2sFbz1j
— $SPONGE (@spongeoneth) March 25, 2025
Join the SPONGE community and be part of the next big crypto sensation! Buy Sponge ($SPONGE) today!