SPONGE/USD ($SPONGE) Technical Outlook: Bulls Eye Recovery Signs
Estimated Reading Time: 2 minutes
Don’t invest unless you’re prepared to lose all the money you invest. This is a high-risk investment and you are unlikely to be protected if something goes wrong. Take 2 minutes to learn more

SPONGE/USD has been trading in a tight consolidation zone near the $0.000078 level, hinting at the potential for a rebound. This stabilization, coming after a sharp bearish leg, suggests that selling momentum is beginning to fade. If bullish sentiment strengthens, a push above the $0.00008 mark could open the door toward the $0.0001 region.
Key Levels to Watch
-
Resistance: $0.000115, $0.000120, $0.000130
-
Support: $0.000075, $0.000070, $0.000065
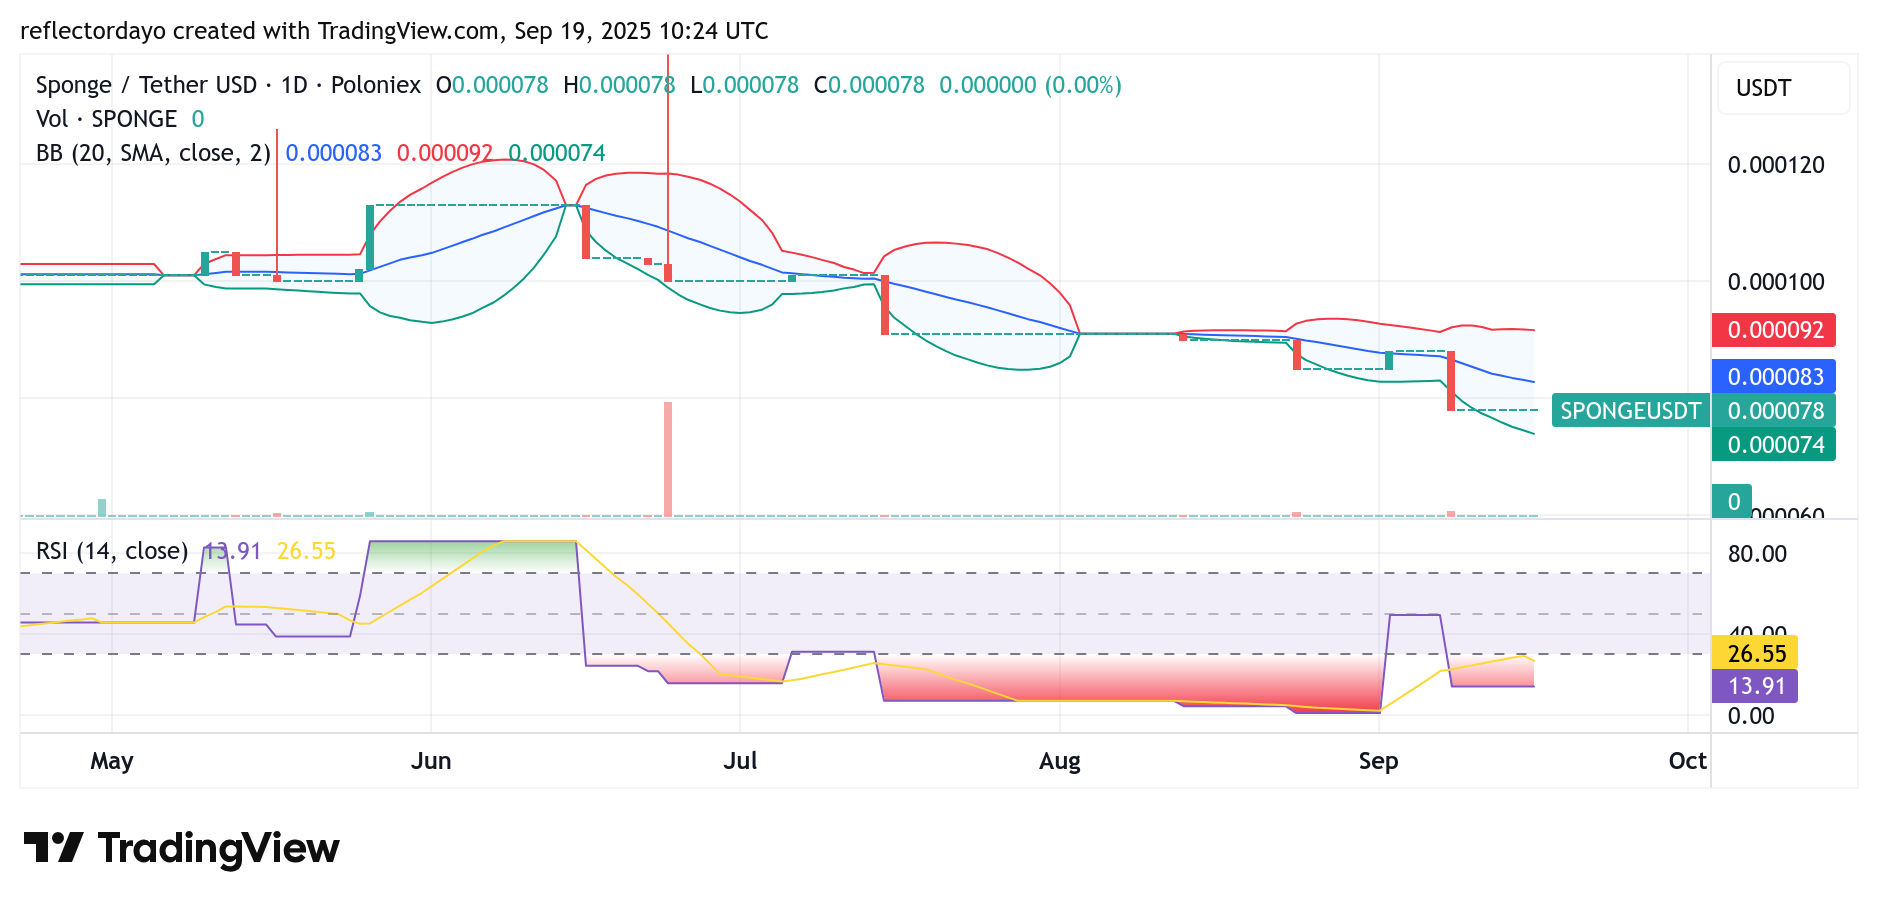
SPONGE/USD Daily Chart View: Oversold Market Signals Opportunity
The heavy sell-off on September 8 triggered wider Bollinger Bands, highlighting increased volatility. Since then, the market has been moving sideways, reflecting a possible pause in bearish momentum. Extended consolidation after such a decline often points to traders quietly positioning for the next move upward.
The RSI remains lodged in oversold territory, reinforcing the idea that downside risks are limited. Historically, oversold conditions tend to attract new buyers looking to enter at discounted levels. If this buying interest continues, SPONGE/USD could stage a corrective bounce, fueling recovery hopes in the near term.
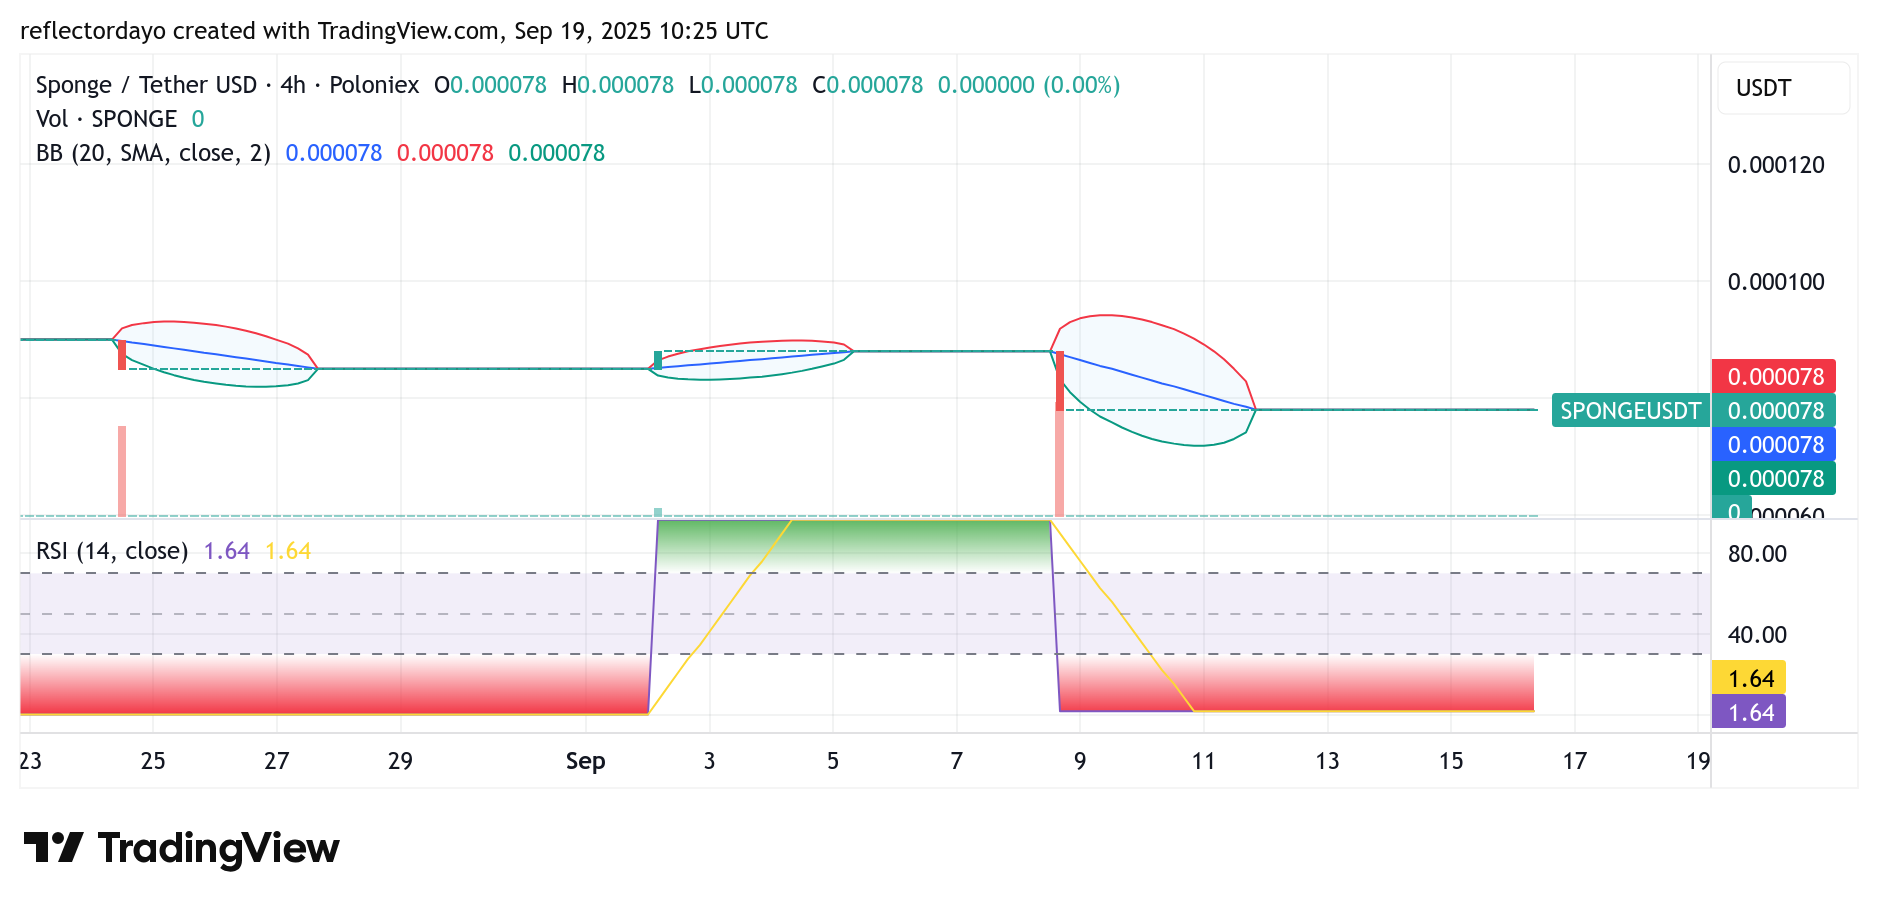
$SPONGE 4-Hour Chart Insight: Breakout Watch
From the intraday perspective, the $0.000078 zone remains the pivot point. The $0.00008 level is the immediate resistance bulls need to break. A move above this hurdle could spark momentum toward $0.0001, while rejection at this point may keep the market contained in its consolidation pattern.
Buy $SPONGE!
This market got me sweatin fr fr pic.twitter.com/4yStsbh6kv
— $SPONGE (@spongeoneth) September 16, 2025
Join the SPONGE community and get in on the next big crypto opportunity! Buy Sponge ($SPONGE) today