Tamadoge (TAMA/USD): Bullish Aspirations Aim for a Breakout Beyond the $0.00814 Price Threshold
Estimated Reading Time: 3 minutes
Don’t invest unless you’re prepared to lose all the money you invest. This is a high-risk investment and you are unlikely to be protected if something goes wrong. Take 2 minutes to learn more
After the TAMA/USD bulls relinquished their control of the $0.008 support level during the latter half of October, bullish traders intervened at approximately the $0.0078 price point to mitigate the persistent bearish pressure. Since that time, the bear market has been effectively constrained from extending beyond this threshold. As the bears reached a balance with the bulls at this juncture, the price has oscillated within the range defined by the $0.0078 support level and the $0.00814 resistance level. At present, there is a notable effort by the bulls to surpass the $0.00814 resistance.
Key Levels
- Resistance: $0.013, $0.014, and $0.015.
- Support: $0.0075, $0.0073, and $0.007.
TAMA/USD Price Analysis: The Indicators’ Point of View
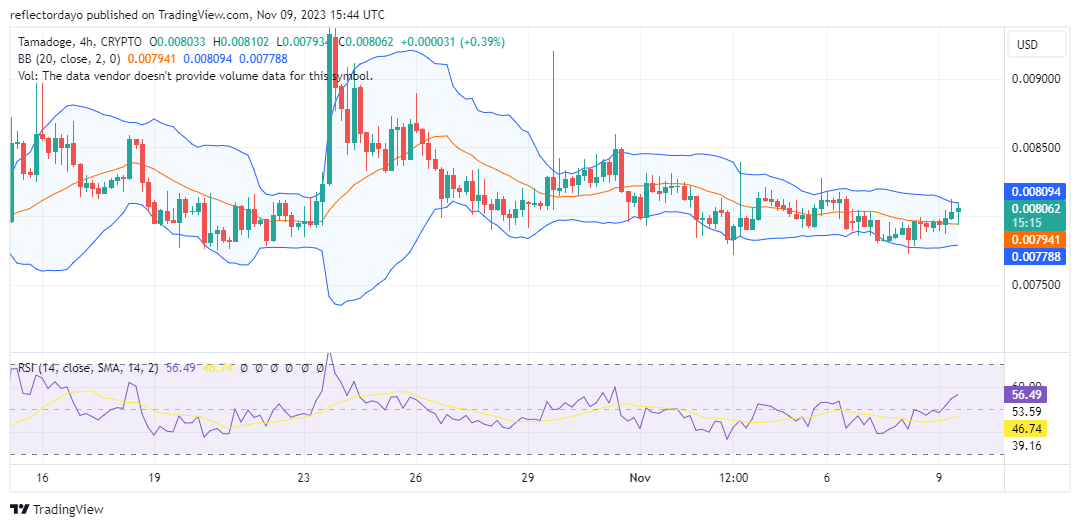
The present TAMA/USD 4-hour candlestick exhibits signs of indecision, despite the elongated upper and lower shadows, indicating active involvement from both buyers and sellers. The presence of a long-legged doji suggests that it is improbable for bullish traders to exert enough influence to break the current price channel and alter the market’s trajectory. It is conceivable that the ongoing tussle at this price level may persist over the course of the next few 4-hour trading sessions before the market establishes a definitive direction.

Tamadoge Short-Term Outlook: 1-Hour Chart
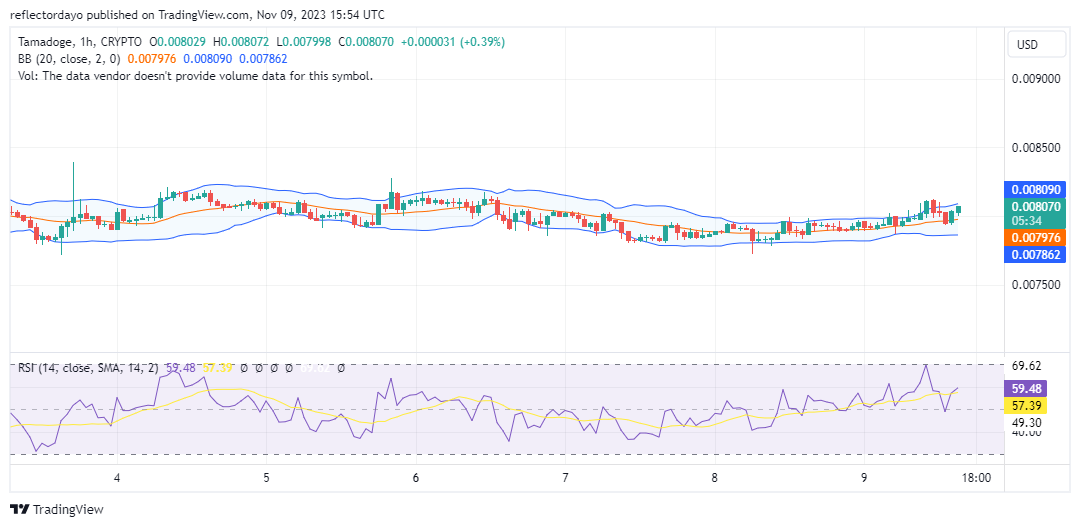
While bullish traders maintain their position within the bullish territory, as indicated by the chart, the price trajectory also aligns with a bullish trend on the 1-hour chart. Nevertheless, the Relative Strength Index (RSI) readings suggest a potential deceleration in bullish momentum, particularly around the 58 price level. Currently, the price appears to be consolidating closely around $0.008, and the narrowing of this range may foreshadow the potential for a bullish price breakout. Furthermore, the latest TAMA/USD candlestick pattern, in the form of a hammer, signifies increased bullish activity.
Enter the Tamadoge giveaway.
Time’s ticking to enter our NFT giveaway ⏰
Secure your entry for a shot at 1 of 5 Tamadoge NFTs – your ticket to earning more $TAMA across all our games.
Enter the @gleamapp competition now 👉 https://t.co/OqeyLwXdxM pic.twitter.com/W5agPvFfWS
— TAMADOGE (@Tamadogecoin) November 9, 2023
Do you want a coin that will be 100 times more valuable in the next few months? That is Tamadoge. Buy TAMA today!