Tamadoge (TAMA/USD) Holds Steady Above $0.001
Estimated Reading Time: 2 minutes
Don’t invest unless you’re prepared to lose all the money you invest. This is a high-risk investment and you are unlikely to be protected if something goes wrong. Take 2 minutes to learn more
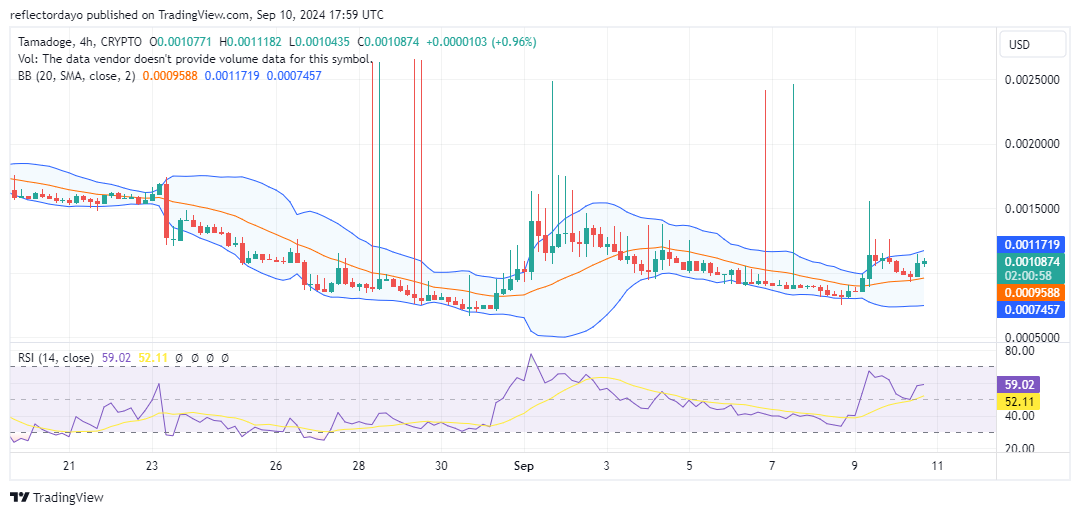
Contrary to previous analysis, the TAMA/USD token has experienced a rally, currently holding above the $0.001 price level. However, recent price action, characterized by descending peaks, suggests that bearish sentiment remains strong.
While the market briefly surged towards $0.0025, bullish efforts have been primarily focused on defending the $0.001 support level. This resilience from buyers could potentially set the stage for a more sustained uptrend. However, it’s essential to monitor the market for any signs of weakening bullish momentum.
Key Levels
- Resistance: $0.013, $0.014, and $0.015
- Support: $0.0008, $0.00078 and $0.00074
TAMA/USD Price Analysis: The Indicators’ Point of View
Technical indicators for Tamadoge are currently presenting a mixed picture. While the market has experienced a notable recovery from the $0.0008 level, recent price action (crypto signal) has been characterized by descending peaks from the $0.0025 high.
Bulls are actively pushing the price towards the $0.0015 level, but they face resistance near the $0.001145 mark. A successful breakout above this level could significantly bolster bullish sentiment and pave the way for further gains.
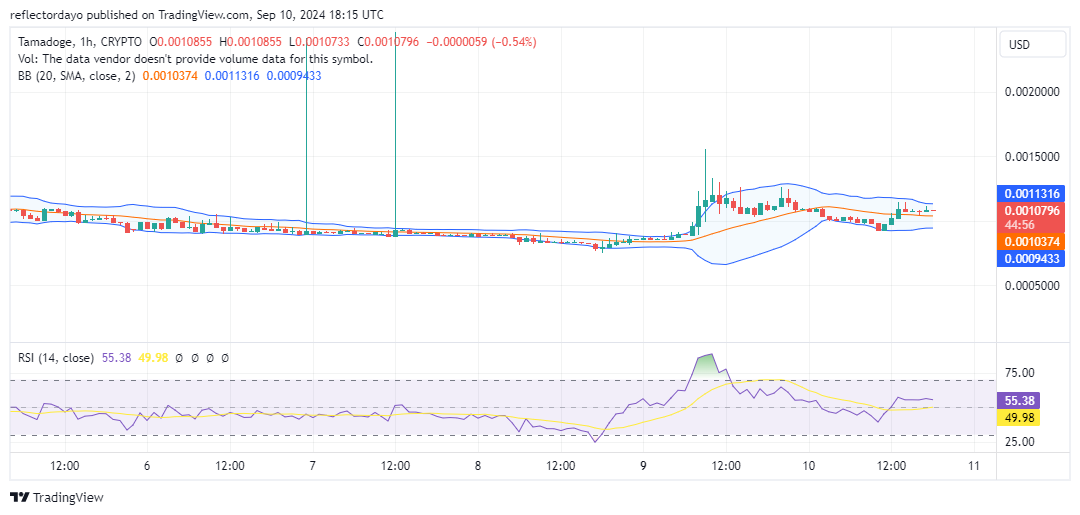
Tamadoge Short-Term Outlook: 1-Hour Chart
The 1-hour chart reveals a period of price consolidation around $0.00108. Traders may be hesitant to enter the market given the recent bearish momentum from the $0.0015 level. However, the possibility of a bullish rebound remains, especially if buyers continue to support the price above the $0.001 mark.
It’s advisable to closely monitor the market for any signs of a breakout or breakdown before making trading decisions.