Tamadoge (TAMA/USD) Holds Steady Near $0.0009, Eyes $0.001 Breakout
Estimated Reading Time: 2 minutes
Don’t invest unless you’re prepared to lose all the money you invest. This is a high-risk investment and you are unlikely to be protected if something goes wrong. Take 2 minutes to learn more
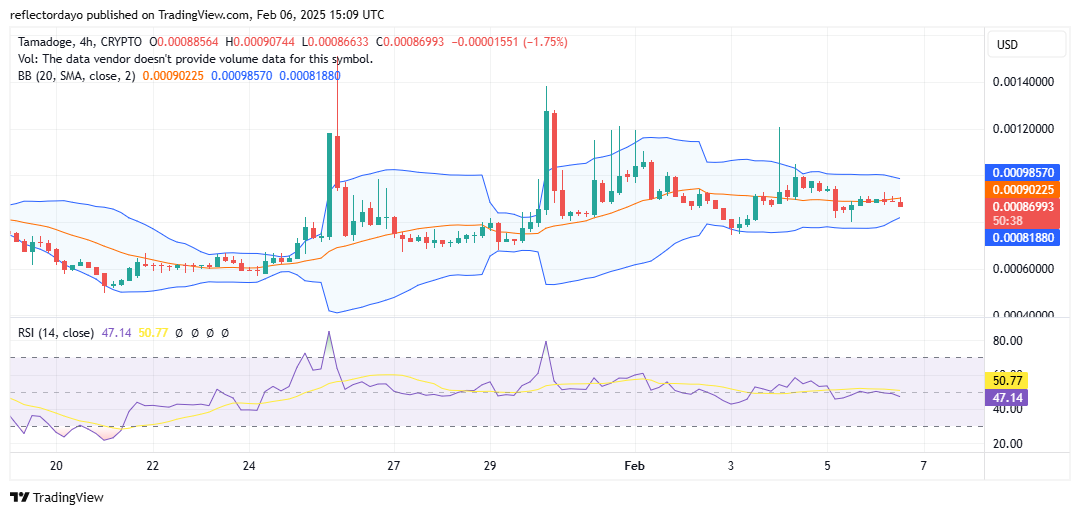
The Tamadoge (TAMA/USD) market is gradually gaining momentum, having found a pivotal bounce around the $0.0008 level and maintaining stability at $0.0009, with $0.001 now within reach. The ongoing battle between buyers and sellers has caused the 20-day moving average and price action to converge at $0.0009, establishing it as a point of equilibrium. A decisive price move—potentially to the upside—appears imminent.
Key Levels
- Resistance: $0.0010, $0.0011, and $0.0012
- Support: $0.0008, $0.00075 and $0.0007
TAMA/USD Price Analysis: The Indicators’ Point of View
The indicator suggests that the Tamadoge market is stabilizing at equilibrium, with price movements confined within a horizontal channel. However, in the current trading session, the market made a minor push downward, though with weak momentum. Despite the bearish move reaching the $0.00086 level, the crypto signal is still in a consolidation phase, and a definitive bearish trend has yet to emerge.
Although the price is currently trending downward, the $0.00085 level is now seen as a potential rebound point. If the market reaches this support, a bounce from this level could trigger a surge toward $0.0009.
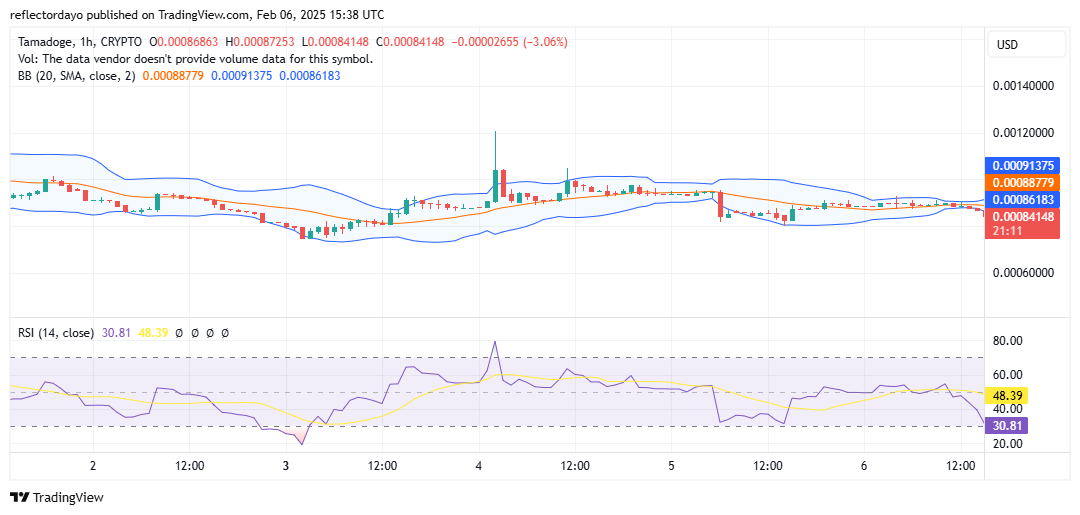
Tamadoge Short-Term Outlook: 1-Hour Chart
Analyzing the Tamadoge market from a 1-hour chart perspective, we observe that the market remains in consolidation within a narrow price channel. The Bollinger Bands indicate a slight bearish advantage, as the price has dipped just below the horizontally ranging 20-day moving average. However, the bears appear to be losing momentum, suggesting that selling pressure may be weakening. If this trend continues, the bulls could soon regain control, leading to a potential rebound.
Buy TAMA/USD!
Fill your weekend by playing five exhilarating play-to-earn arcade games! 🕹️💰
Battle your way to the top of the weekly leaderboards and load up on $TAMA rewards!
Download on mobile now 👇
📱 Android: https://t.co/D4TjX7gTFl
📱 iOS: https://t.co/0fjJapf5oA pic.twitter.com/6MCruiKcet— TAMADOGE (@Tamadogecoin) September 13, 2024