Tamadoge (TAMA/USD) Slowly Gaining Bullish Momentum
Estimated Reading Time: 3 minutes
Don’t invest unless you’re prepared to lose all the money you invest. This is a high-risk investment and you are unlikely to be protected if something goes wrong. Take 2 minutes to learn more
The TAMA/USD market is gradually gaining upward momentum as it tests higher price levels. Recently, the price dropped from around $0.0008 to approximately $0.0005, presenting a buying opportunity for traders. Initially, the $0.0008 level proved to be a strong resistance, as bears had established dominance at that zone.
However, in a surprising turn of events, the price surged to around $0.0014 before undergoing a sharp correction that quickly brought it back down. Despite this pullback, bulls resumed buying pressure just above the $0.0008 level, signaling renewed bullish interest.
Key Levels
- Resistance: $0.0010, $0.0011, and $0.0012
- Support: $0.0008, $0.00075 and $0.0007

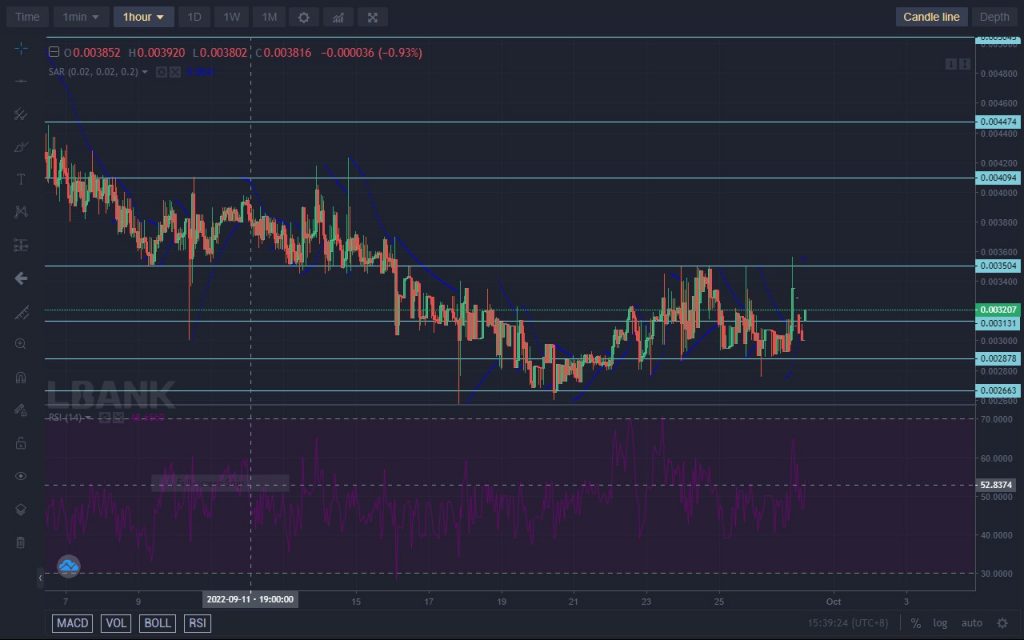
TAMA/USD Price Analysis: The Indicators’ Point of View
The strong upward breakout, which peaked at $0.0014, has allowed TAMA/USD bulls to reclaim their previous position around the $0.0008 level. In fact, they have now pushed slightly above it. Due to strong bullish momentum, the previous bearish move was halted, stabilizing the price at approximately $0.00083.
This development suggests the potential for a rebound, with the price possibly surging toward the $0.001 level. However, a brief consolidation at the current level may occur before the upward move fully materializes. Additionally, the Relative Strength Index (RSI) shows the price fluctuating around the midpoint, indicating market indecision. This could lead to continued consolidation, strengthening the bulls’ position before the next upward breakout.

Tamadoge Short-Term Outlook: 1-Hour Chart
The 1-hour chart of the TAMA/USD market suggests that bulls have established a strong position around the $0.000834 level. For a significant period, the candlesticks have predominantly been dojis, signaling market indecision at this price point.
If this pattern persists, the Bollinger Bands, which have so far reflected substantial volatility, may start to contract into a narrow price range. This ongoing standoff between buyers and sellers could lead to reduced market volatility, often a precursor to a decisive breakout in either direction. Traders should monitor this consolidation closely for potential price movement.
Buy Tamadoge!
Fill your weekend by playing five exhilarating play-to-earn arcade games! 🕹️💰
Battle your way to the top of the weekly leaderboards and load up on $TAMA rewards!
Download on mobile now 👇
📱 Android: https://t.co/D4TjX7gTFl
📱 iOS: https://t.co/0fjJapf5oA pic.twitter.com/6MCruiKcet— TAMADOGE (@Tamadogecoin) September 13, 2024