UMAUSD (UMA) Is Set to Commence Its Bullish Structure Formation
Estimated Reading Time: 2 minutes
Don’t invest unless you’re prepared to lose all the money you invest. This is a high-risk investment and you are unlikely to be protected if something goes wrong. Take 2 minutes to learn more

UMAUSD Analysis – The Price Is Set to Commence Its Bullish Structure Formation
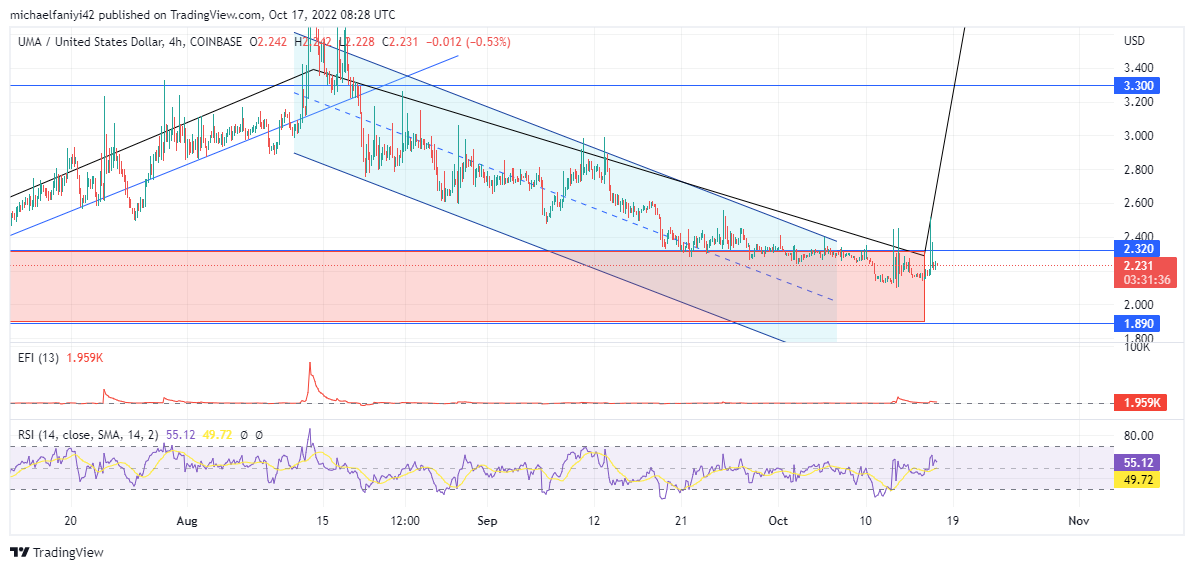
UMAUSD is set to commence its bullish structure formation to push its market to a higher price level. The coin has been majorly under the influence of the sellers for a while now. The buyers are trying to force a break in the structure by using the double-bottom chart pattern, which is a bullish reversal formation. If it works out, the coin will rise to test the $4.000 resistance level.
UMAUSD Critical Levels
Resistance Levels: $4.000, $3.300
Support Levels: $2.320, $1.890
After being suppressed below $3.300 for more than three months, the coin gained strength to force itself through the barrier. As a result, UMAUSD rose to $4.000 but could neither rise above it nor even maintain the price level. This led to an almost instant drawback below the $3.300 resistance level. Nevertheless, this forms a pattern that can potentially play in the buyers’ favor.
The demand level has been very crucial for the bulls, having kept the market from sinking below it. The demand level stretches from $2.320 to $1.890. UMAUSD is expected to spring upward from this level. The rise of the EFI (Elders Force Index) power line into a positive value is a welcome development by the buyers to conform to and eventually execute the bullish formation.
Market Expectation
The 4-hour chart shows a persistent desire of the market to use the $2.320 price level as a springboard. However, the price is currently still stuck below the support zones. The RSI (Relative Strength Index) indicator has bounced off the oversold border on the daily chart and has climbed further above the middle line on the 4-hour chart. This shows progress among the buyers. UMAUSD will rally to reach $4.000 if they successfully execute their plan.
You can purchase Lucky Block here. Buy LBLOCK
Note: Cryptosignals.org is not a financial advisor. Do your research before investing your funds in any financial asset or presented product or event. We are not responsible for your investing results.