Uniswap Price Prediction: UNI/USDT Faces Strong Headwinds
Estimated Reading Time: 2 minutes
Don’t invest unless you’re prepared to lose all the money you invest. This is a high-risk investment and you are unlikely to be protected if something goes wrong. Take 2 minutes to learn more

Uniswap Price Prediction (February 20):
The Uniswap market has been retracing to lower price levels since mid-January. However, the downward movement has consolidated around the $9.00 price level. Despite this, price action remains below key technical landmarks. Let’s take a closer look at the market below.
UNI/USDT Long-Term Trend: Bearish (Daily Chart)
Key Price Levels:
Resistance: $10.00, $12.00, $14.00
Support: $9.00, $8.00, $7.00
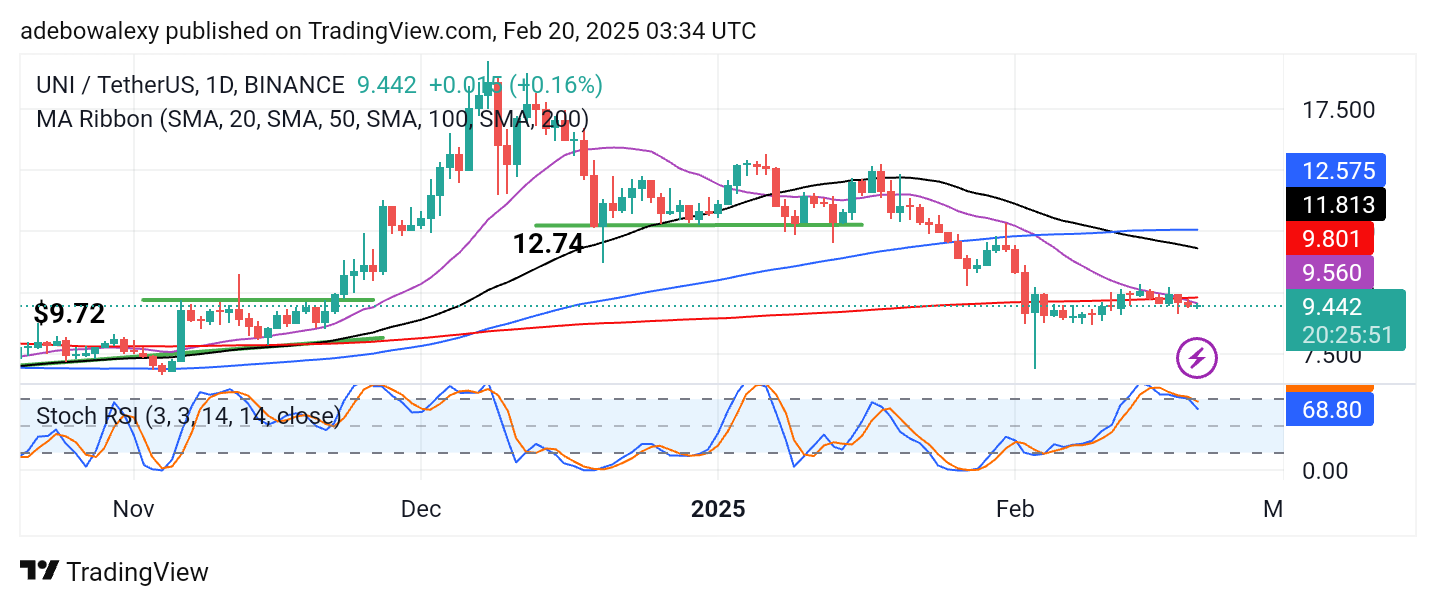
As noted above, price activity in the Uniswap market currently resides below all the Moving Average (MA) lines. This has been the case since the previous session, with recent price candles hovering around the 200-day MA line. The latest price candle on the chart is green but heavily compressed. Meanwhile, the Stochastic Relative Strength Index (RSI) lines are slightly declining toward the 50 level of the indicator.
Uniswap Price Prediction: UNI/USDT Market Remains Vulnerable to Further Declines
Technical indicators on the Uniswap daily chart suggest that, although there is some uptick in bullish momentum, price action remains vulnerable to further declines.
As we can see, the last price candle remains below all the MA lines on the daily chart, which presents a strong headwind for the ongoing session and contributes to the compressed appearance of the price candle. Additionally, the movement of the Stochastic RSI lines is not very encouraging at the moment, aligning with the view that prices may continue to decline.
Uniswap Price Prediction: UNI/USDT Retains a Subdued Outlook (4-Hour Chart)
Extending the price analysis to a 4-hour chart reveals a consistent price movement pattern. The last price candle on the chart remains below all the MA lines observed on the daily chart.
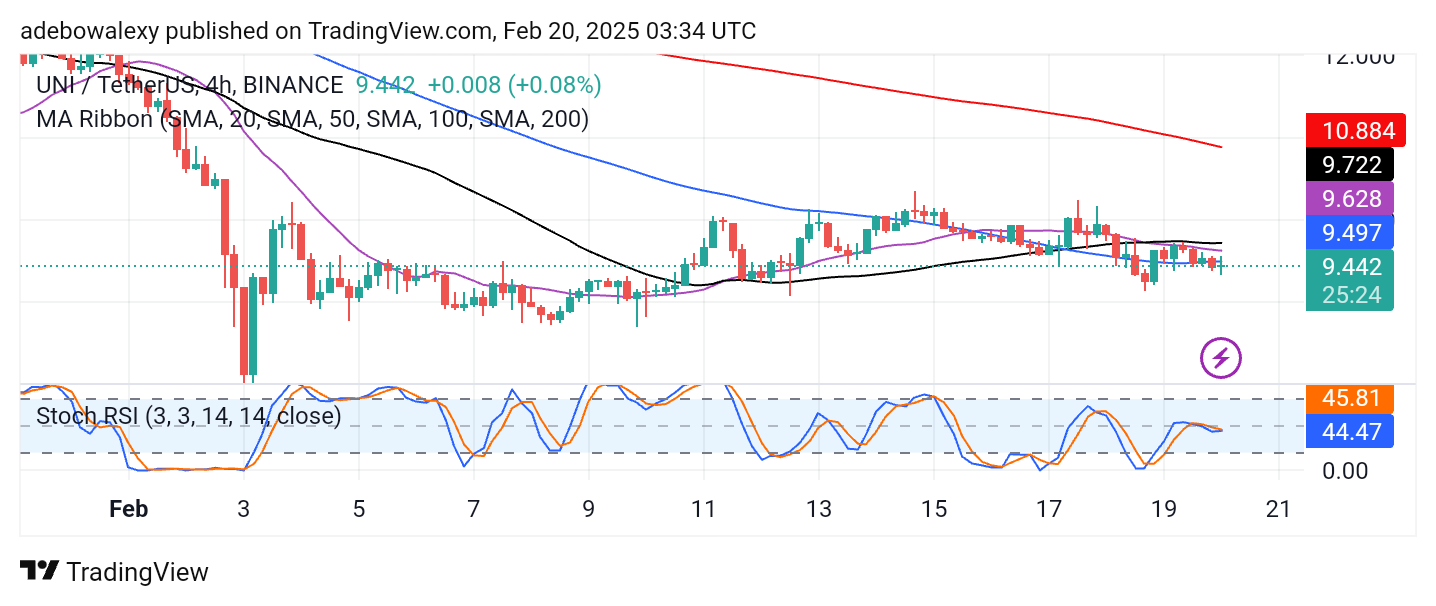
However, the last price candle on this 4-hour chart appears as a spinning top candle, indicating indecision in the market.
Meanwhile, the Stochastic RSI lines are now approaching a crossover after turning sideways just below the 50 level of the indicator. Consequently, while the market remains vulnerable, technical indicators hint at a possible short-term gain toward the $10.50 price level.