Uniswap (UNI) Price Prediction: UNI/USDT May Have Found New Support
Estimated Reading Time: 3 minutes
Don’t invest unless you’re prepared to lose all the money you invest. This is a high-risk investment and you are unlikely to be protected if something goes wrong. Take 2 minutes to learn more

Uniswap (UNI) Price Prediction: January 30
The Uniswap token shows a notable correlation with the Bitcoin market. This is because BTC has been declining, breaching medium-term support levels in recent sessions. However, with Bitcoin breaking above the $105,000 ceiling, UNI has followed suit, retracing toward higher price levels.
UNI/USDT Long-Term Trend: Bullish (Daily Chart)
Key Price Levels:
Resistance: $13.00, $14.00, $15.00
Support: $11.00, $10.00, $9.00
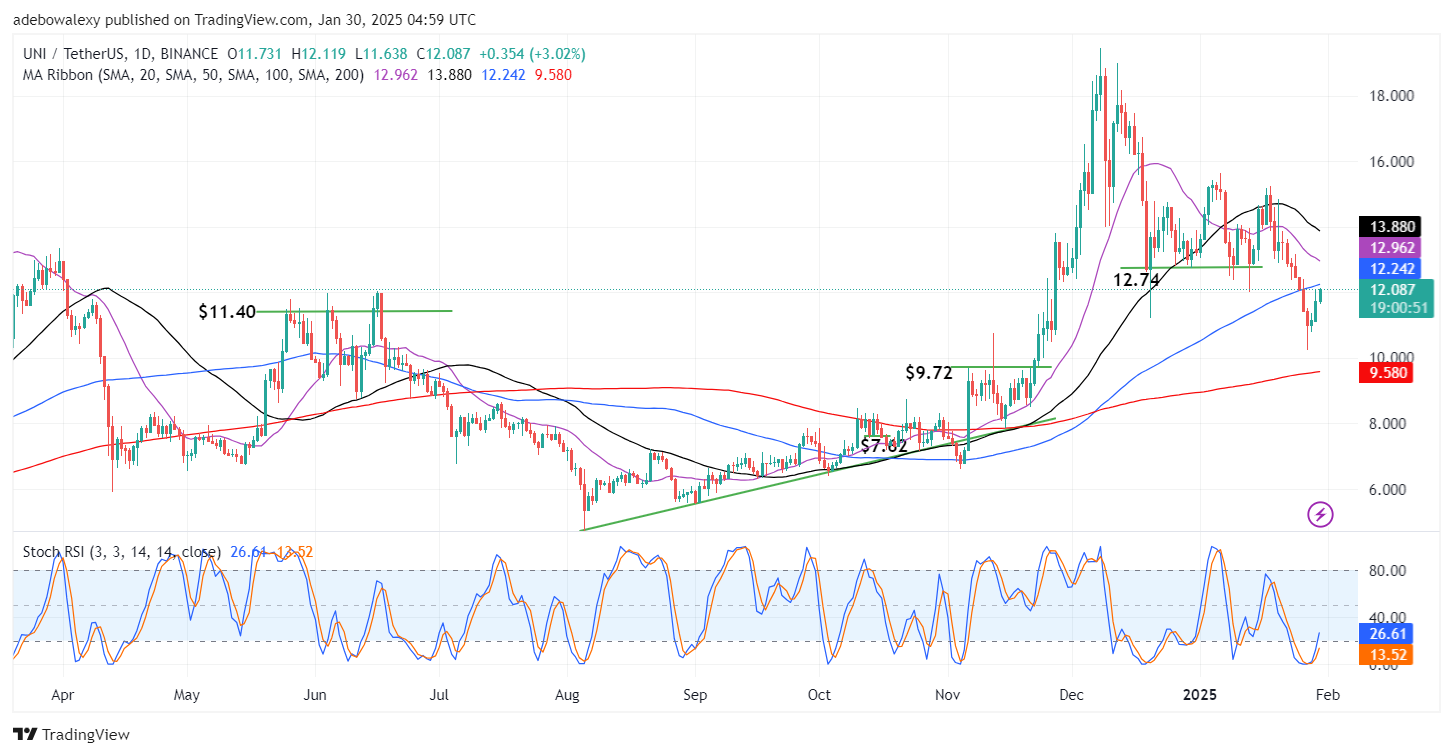
An upside retracement appears to have begun in the Uniswap market over the past two sessions. The current session has extended this trend, pushing UNI’s price higher. As a result, the latest price candle has brought the market closer to testing the 100-day Moving Average (MA) line as a resistance level. At the same time, the Stochastic Relative Strength Index (RSI) lines are rising toward higher levels after emerging from the oversold zone.
Uniswap (UNI) Price Prediction: Poised to Advance Beyond the $12.00 Threshold
Price action in the Uniswap daily chart recently dipped below the $12.74 level, which had served as strong support in previous sessions. However, buyers quickly stepped in when the price tested support around $11.00. This resulted in a swift rebound, pushing UNI back above the $12.00 price mark.
The Stochastic RSI indicator further supports this bullish movement, as its lines are now rising out of the oversold region. Additionally, the latest price candle shows an upper shadow, indicating that buying pressure is still present in the session. Given these factors, UNI appears positioned for further gains in the near term.
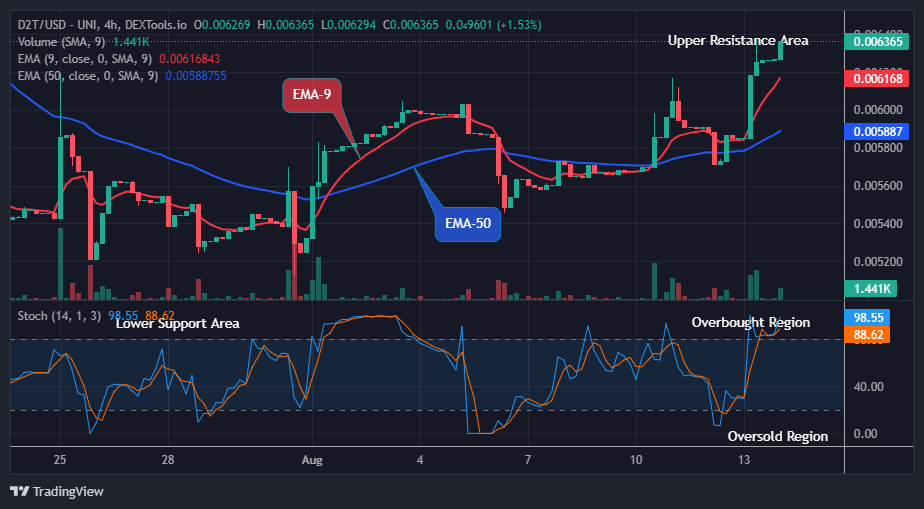
Uniswap (UNI) Price Prediction: Uniswap Crosses a Medium-Term Technical Landmark (4-Hour Chart)
Uniswap’s 4-hour chart remains bullish, with the latest price candle nearing a key technical level at $12. This movement has also placed UNI above the 50-day MA line. Furthermore, the Stochastic RSI indicator recently formed a bullish crossover above the 80 level, with the lines continuing to trend upward.
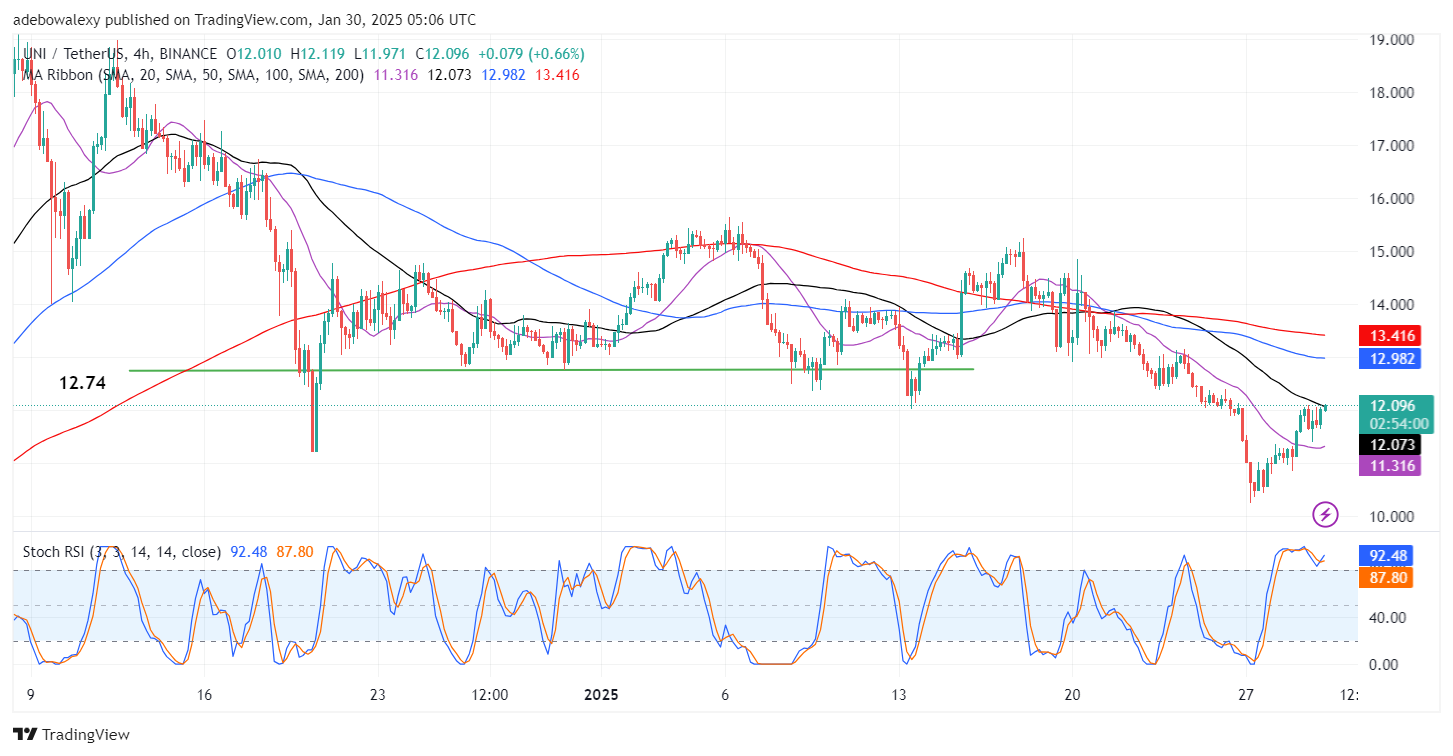
Market indications suggest that Uniswap has a strong foundation to extend its rally. The breakout above the 50-day MA signals growing bullish momentum, while the Stochastic RSI trajectory confirms the presence of upward pressure. As a result, the market seems to be heading toward the $12.50 price level and potentially higher.