Bitcoin (BTC) Price Prediction: BTC/USDT May Have Found New Support
Estimated Reading Time: 3 minutes
Don’t invest unless you’re prepared to lose all the money you invest. This is a high-risk investment and you are unlikely to be protected if something goes wrong. Take 2 minutes to learn more

Bitcoin resumed trading above the $100,000 mark about 10 sessions ago. Since then, the token has consistently remained above this threshold. More importantly, it has sustained a position above the $101,184 level, suggesting that BTC may have found strong support at this price point.
BTC/USDT Long-Term Trend: Bullish (Daily Chart)
Key Price Levels:
Resistance: $105,000, $110,000, $150,000
Support: $100,000, $95,000, $90,000
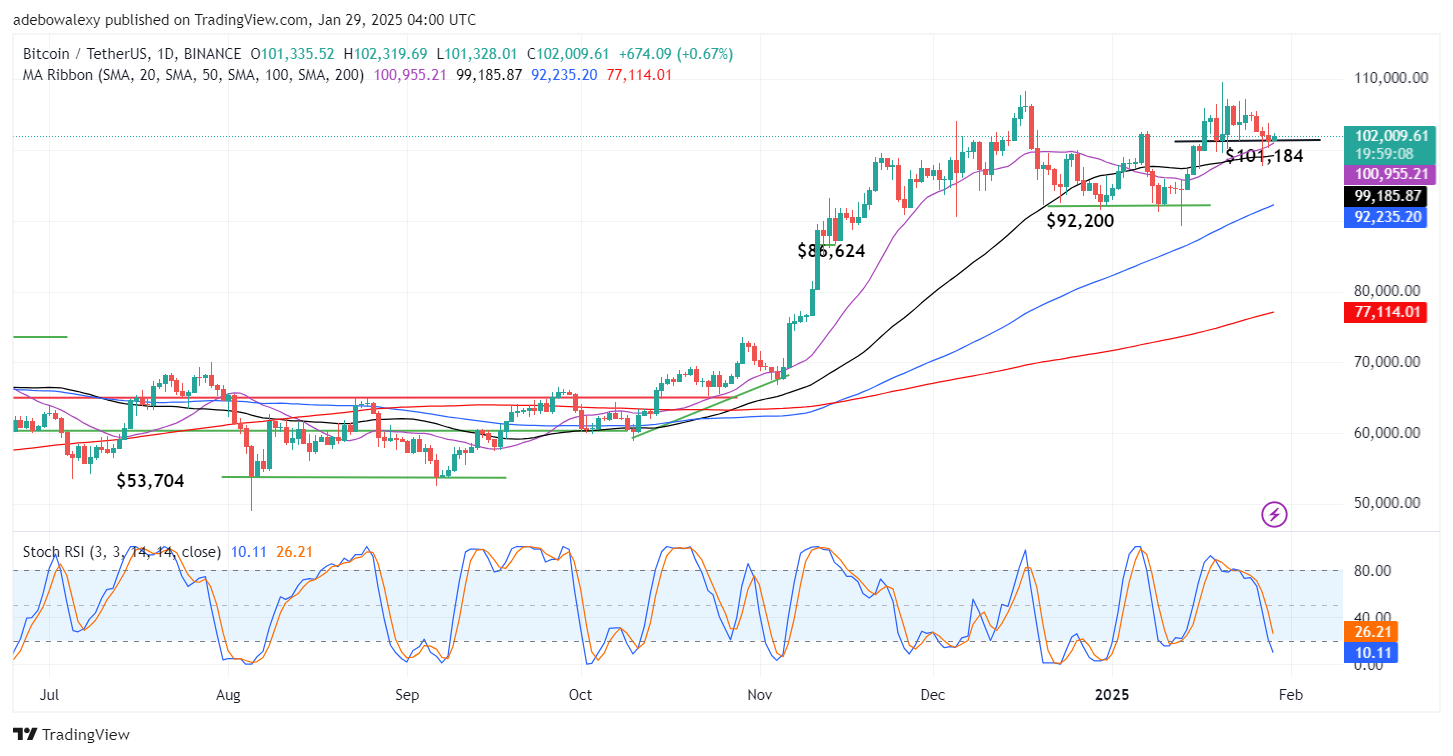
A green price candle has formed to represent today’s trading activity. This candle has emerged directly off the $101,184 support level and remains above the 20-day Moving Average (MA) line, as well as all other MA lines on the chart. Meanwhile, the Stochastic Relative Strength Index (RSI) indicator continues to decline sharply into the oversold region.
Bitcoin (BTC) Price Prediction: Tailwinds May Drive BTC Higher
Price action on the Bitcoin daily chart suggests that BTC has established new support above the $101,000 price mark. Additionally, the position of today’s price candle indicates that bullish momentum could be gaining strength. However, the Stochastic RSI indicator lines continue to descend into the oversold region.
This decline appears to result from the price drop observed over the past three sessions. However, the movement of the Stochastic RSI lines seems exaggerated, signaling that bearish momentum may be weakening. This could provide an opportunity for an upside retracement. Given that the latest price candle remains above all MA lines, an upward move could be imminent.
Bitcoin (BTC) Price Prediction: Short-Term Market Outlook (4-Hour Chart)
On the Bitcoin 4-hour chart, the latest price candle remains green, consistent with observations from the daily chart. Additionally, the current price of BTC is positioned between the 20-, 50-, 100-, and 200-day MA lines, which appear to be widening.
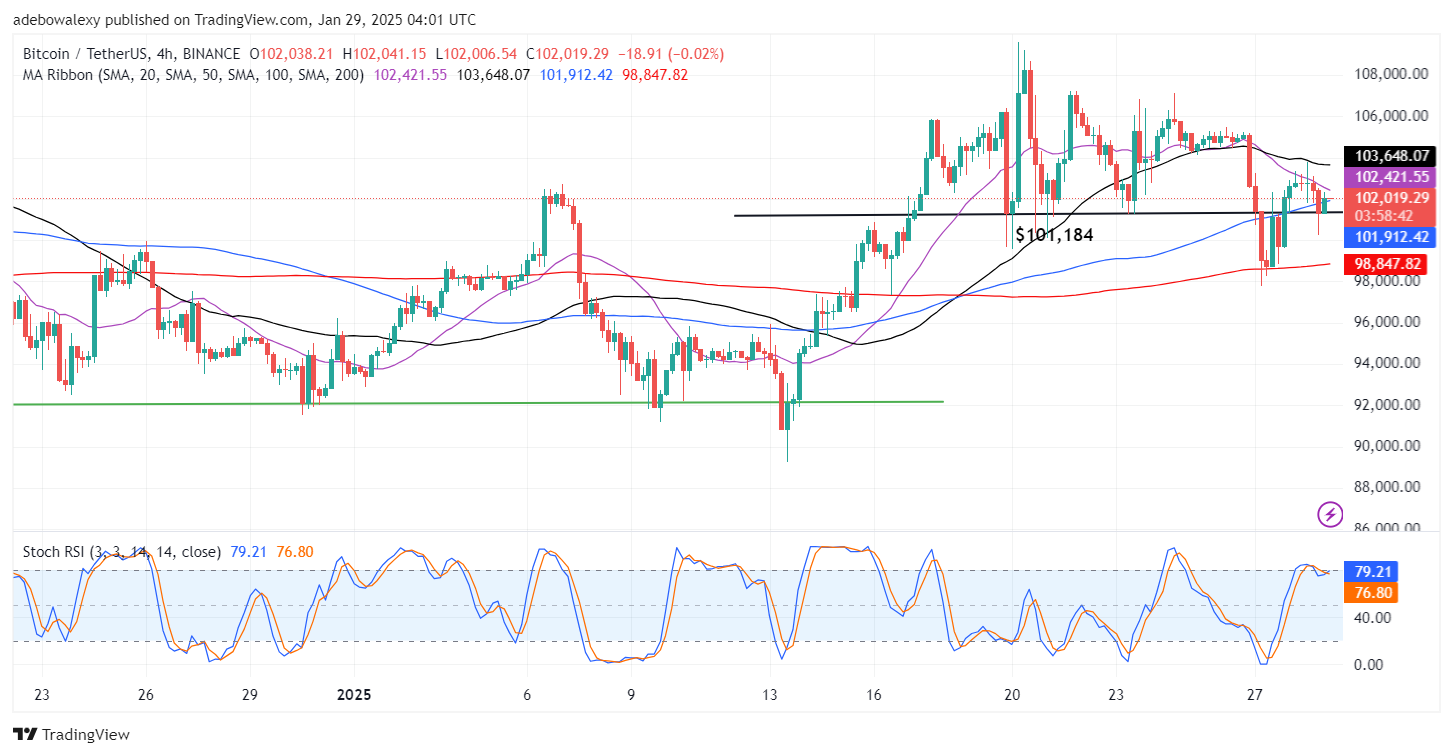
Moreover, the Stochastic RSI lines have converged just below the 80 mark. This setup is promising, as an upside crossover has already occurred in the overbought region, suggesting that bullish momentum may intensify. Consequently, the market appears poised for short-term price increases.
Given these technical indicators, traders could target a retracement toward the $105,000 price level, as the likelihood of reaching this mark seems high based on current market signals.