Litecoin (LTC) Price Prediction: LTC/USDT Trades Above $110, Keeps $130 in Focus
Estimated Reading Time: 3 minutes
Don’t invest unless you’re prepared to lose all the money you invest. This is a high-risk investment and you are unlikely to be protected if something goes wrong. Take 2 minutes to learn more

Litecoin (LTC) Price Prediction (January 28):
Price activity in the Litecoin market remains volatile and has been so ever since the market broke through the $70 resistance level. This breakout provided the momentum needed to push higher. Currently, price action remains volatile, with two technical resistance levels serving as short-term targets.
LTC/USDT Long-Term Trend: Bearish (Daily Chart)
Key Price Levels:
Resistance: $120, $130, $140
Support: $110, $100, $90
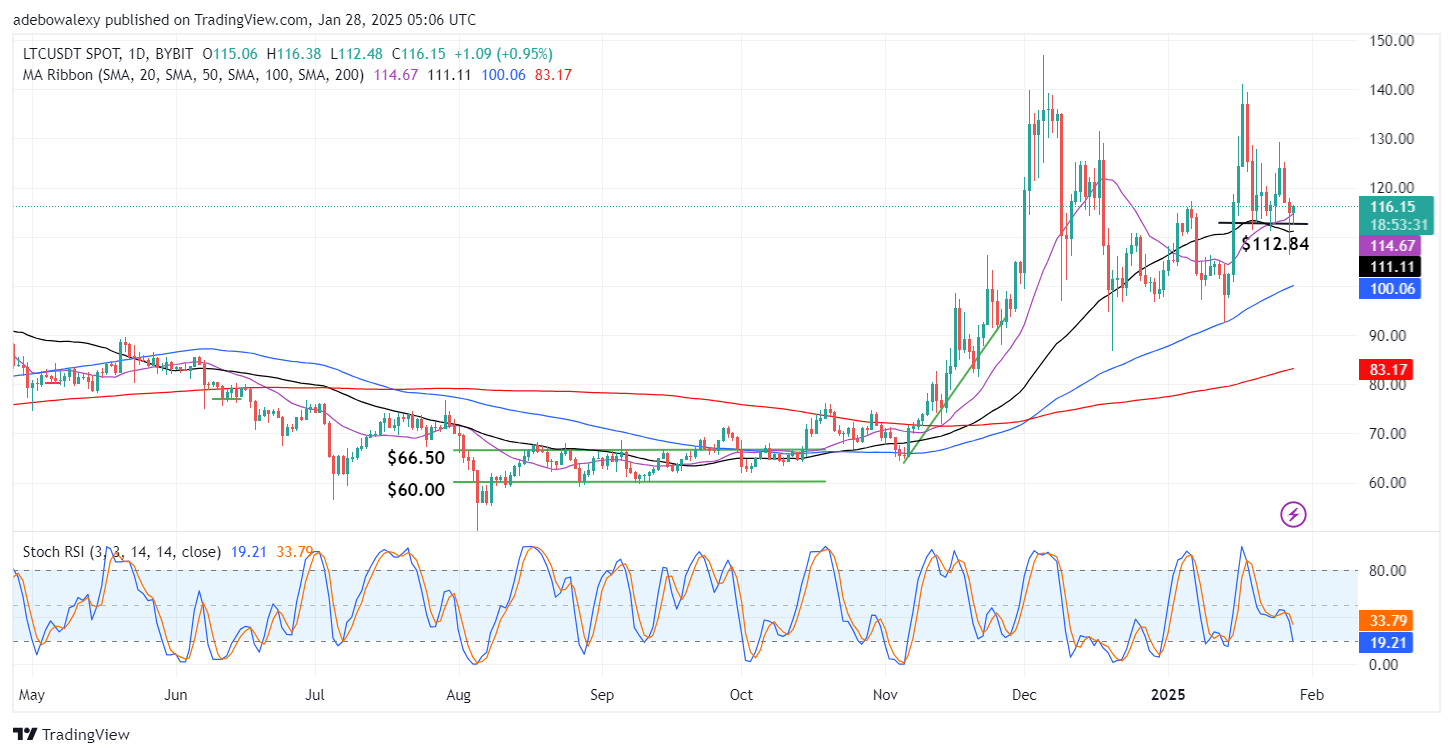
The latest price candle on the Litecoin daily chart is green and appears upwardly contracted. It is positioned just above the 20-day Moving Average (MA) line. This indicates that price action is currently above all the MA lines on the chart. However, the Stochastic Relative Strength Index (RSI) lines are still sharply angled toward the oversold region, signaling potential downward pressure.
Litecoin (LTC) Price Prediction: LTC Sustains Above Key Levels
Litecoin’s price activity has been fluctuating significantly within the $110 to $130 range. As noted, the ongoing session remains above the 20-day MA line, with the price candle showing an upward contraction. This indicates that bullish forces are attempting to propel the market higher, but they are facing strong resistance.
The Stochastic RSI lines, however, continue to drop into the oversold region, suggesting weakening momentum. Nonetheless, the green color of the last price candle and its position above all MA lines point to lingering upside potential. Therefore, further price increases could still occur.
Litecoin (LTC) Price Prediction: LTC Maintains Upside Focus (4-Hour Chart)
On the Litecoin 4-hour chart, price action previously fell below the $112.84 level but experienced a sharp recovery. Currently, the market is positioned above this support level. The latest price candle has also breached the resistance formed by the 100-day MA line.
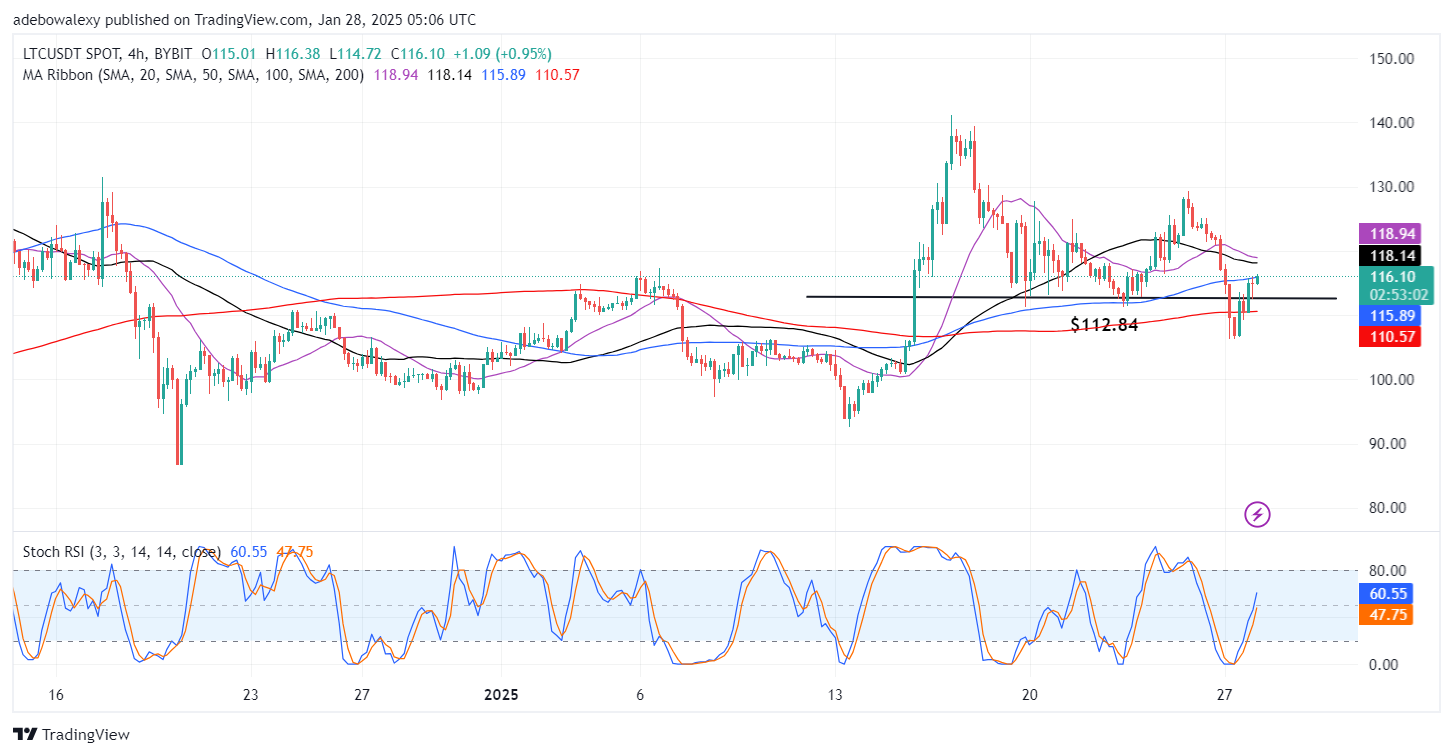
Moreover, the Stochastic RSI lines are rising. The leading line has crossed above the 50 mark, while the lagging line remains just below it. This indicates strong volatility, which may aid the market in retracing to the $120 level. If the $120 level is breached, the $130 mark could be the next target.