XRP Reaches a Potential Rebound or Breakdown at the $0.53 Low
Estimated Reading Time: 2 minutes
Don’t invest unless you’re prepared to lose all the money you invest. This is a high-risk investment and you are unlikely to be protected if something goes wrong. Take 2 minutes to learn more

XRP (XRP) Long-Term Analysis: Ranging
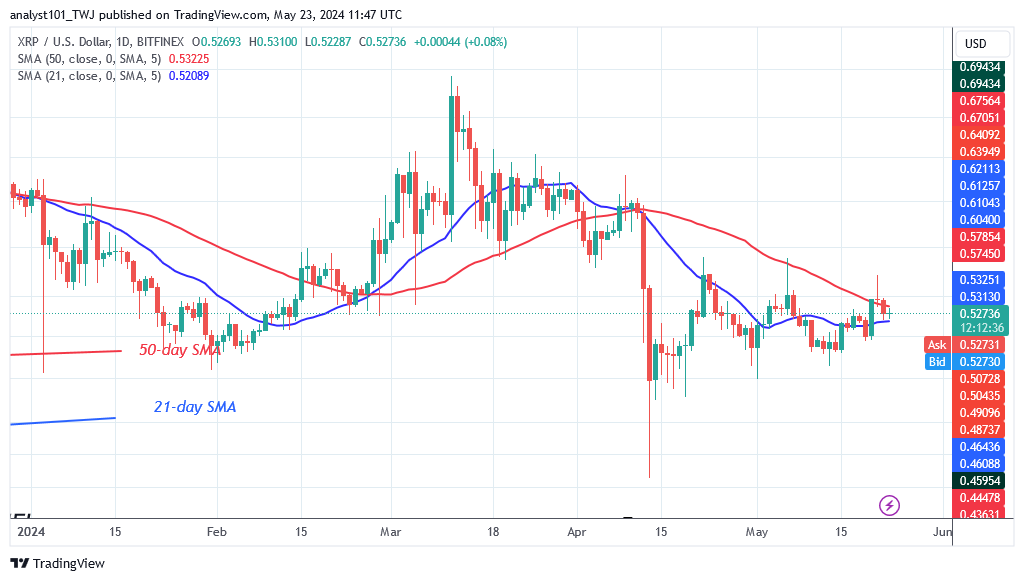
The XRP (XRP) price has been on a sideways trend since April 13 but is now in a tight range at the $0.53 low. The cryptocurrency is currently trading in a tight range between the $0.46 support and below the moving average lines or the $0.53 resistance. On May 20, the bulls broke above the moving averages but were driven back. The rejection of the 50-day SMA calls into question the cryptocurrency’s rising trajectory.
XRP is retracing and has dropped between the moving average lines. On the downside, if the bears break through the 21-day SMA or the $0.52 support, the altcoin will fall to its current level of $0.49. On the other hand, buyers will drive XRP to a high of $0.57 if bulls break through the 50-day SMA barrier. XRP/USD is presently worth $0.53 as of this writing.
Technical Indicators:
Major Resistance Levels – $1.00, $1.50, $2.00
Major Support Levels – $0.50, $0.30, $0.10
XRP (XRP) Indicator Analysis
Currently, XRP is caught between the moving average lines and trading in a narrow range. The altcoin’s price is approaching a potential rebound or breakdown. The price action is represented by a candlestick with extended wicks and tails.
What Is the Next Direction for XRP (XRP)?
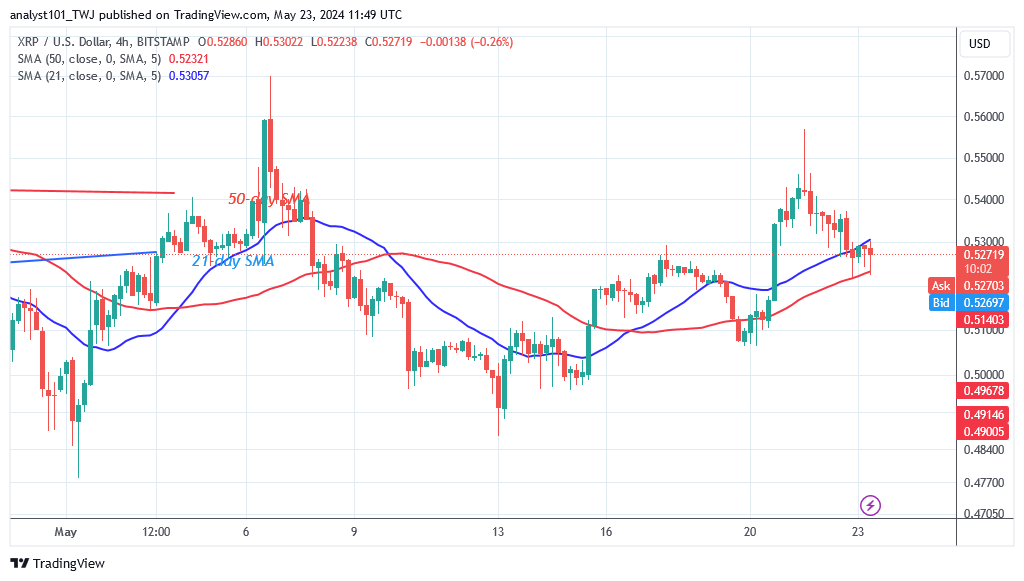
XRP is caught between the moving average lines at the $0.53 low. On the 4-hour chart, the altcoin is trapped, and the cryptocurrency’s price is underselling and buying pressure. XRP was caught between the moving average lines after spiking to a low of $0.51 and a high of $0.54. In other words, the crypto signal is ranging because it is locked within a specific range.
You can purchase crypto coins here. Buy LBLOCK
Note: Cryptosignals.org is not a financial advisor. Do your research before investing your funds in any financial asset or presented product or event. We are not responsible for your investing results