Wall Street Memes (WSM) Market Hovers, Creating Upward Waves
Estimated Reading Time: 3 minutes
Don’t invest unless you’re prepared to lose all the money you invest. This is a high-risk investment and you are unlikely to be protected if something goes wrong. Take 2 minutes to learn more
Wall Street Memes Price Prediction – April 21
Forces have continually played out between buyers and sellers in lighter formations, pushing below the trade line of $0.001, as the WSM/USD market operation hovers near a baseline, creating upward waves.
The market continues to range, with daily signals offering encouraging signs for long-term entry opportunities. As price action hovers near key levels, the lower Bollinger Band serves as a valuable guide for identifying favorable buying zones—setting the stage for a potential upside once a breakout above $0.001 materializes.
WSM/USD Market
Key Levels
Resistance levels: $0.0015, $0.002, $0.0025
Support levels: $0.0008, $0.0006, $0.0004
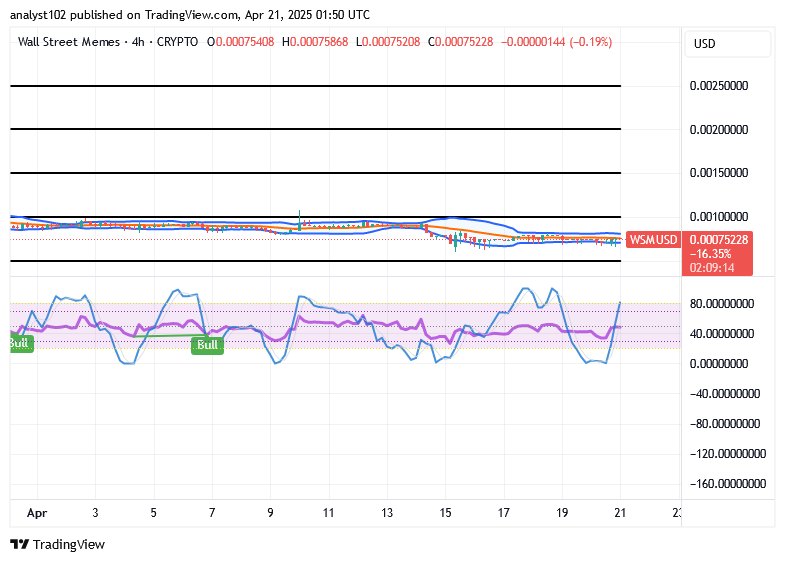
WSM/USD – 4-hour Chart
The WSM/USD medium-term chart setting showcases that the crypto-economic trade hovers near a basement, creating upward waves.
The positional situations of the stochastic oscillators have remained swerving freely on the bullish arrangement. The Bollinger Bands are getting straight up to the east direction, affirming that ranging impulses are being upheld, with gradual momentum building toward a potential breakout phase.
Based on current analytical indicator configurations, is a breakout from the WSM/USD market’s consolidation phase imminent?
Practically, a shootout in the pricing actions of WSM/USD market is tenable to occur abruptly in no time, as the financial stand shows that the crypto-economic price hovers on a baseline, creating upward waves.
A conclusive pattern appears to be forming, characterized by successive lower lows and lower highs across the declining trading zones in which the pairing market currently operates. If this structural sentiment holds, buyers should remain focused on recovery-driven strategies to capitalize on potential reversal setups. However, the persistent downward pressure suggests that any bullish attempt may face immediate resistance, limiting upside momentum in the short term.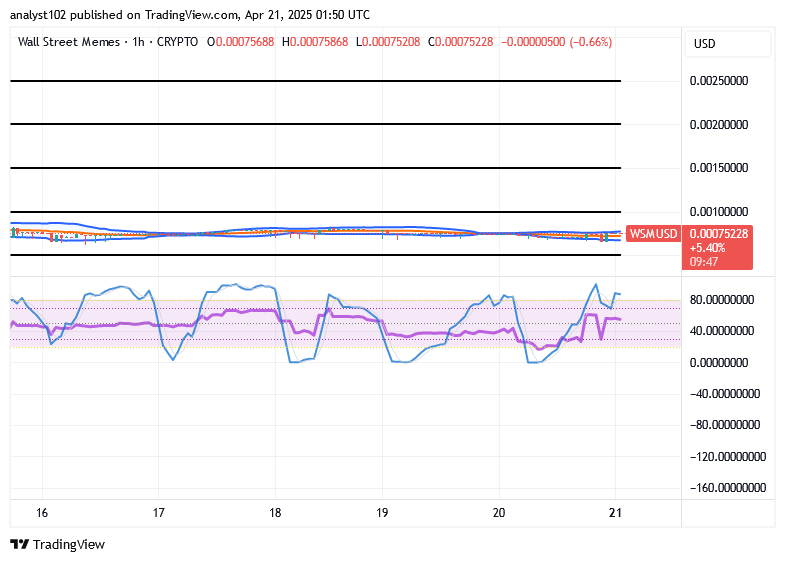
WSM/USD 1-hour chart
The hourly compositions of the WSM/USD market signify that the crypto-economic trade reactivates its basis, gaining momentum.
The stochastic oscillators have stabilized in the oversold region, indicating a potential bullish reversal as selling pressure weakens and market exhaustion becomes more evident. Meanwhile, the Bollinger Bands continue to stretch steadily in an eastward direction, establishing a firm horizontal range between $0.001 and $0.0005. This convergence suggests a build-up of momentum, with the potential for a breakout as volatility compresses and price stability sets the stage for upward movement.
BIGTIMEUSDT & WSMUSDT perpetual contracts are now live on Bybit—trade, hedge, speculate, profit, and explore new opportunities today!
🚀 BIGTIMEUSDT & WSMUSDT Contracts now on Bybit!
— Bybit (@Bybit_Official) October 12, 2023
Dive into new trading opportunities with 1-25x leverage. Plus, they’re now on Bybit Futures Grid Bot! Start trading now.
📈 BIGTIME: https://t.co/FAQlbhnzAh
📈 WSM: https://t.co/pb2y2AfMBE#CryptoTrading #Bybit