XRP Rebounds but Fails to Surpass the $0.64 High
Estimated Reading Time: 2 minutes
Don’t invest unless you’re prepared to lose all the money you invest. This is a high-risk investment and you are unlikely to be protected if something goes wrong. Take 2 minutes to learn more
XRP (XRP) Long-Term Analysis: Bullish
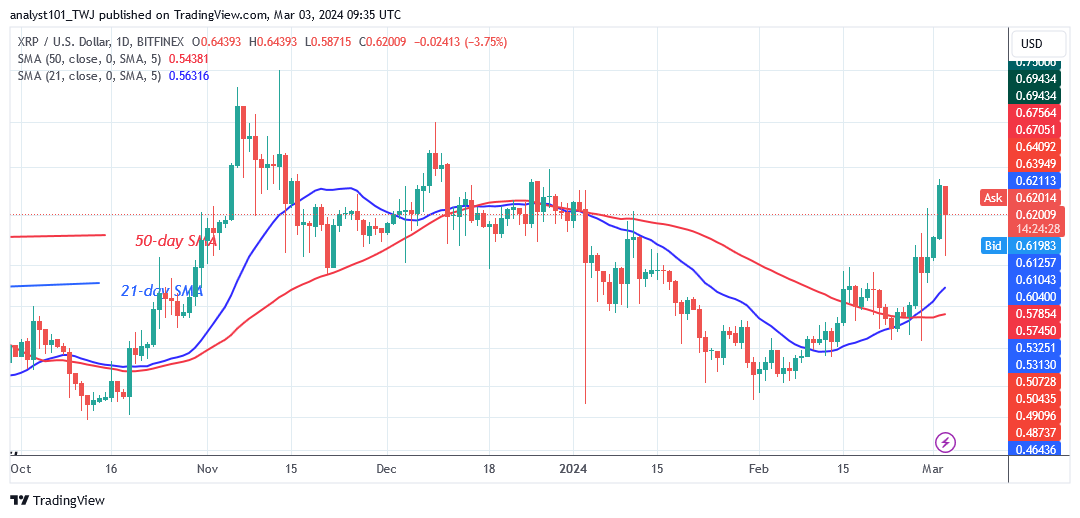
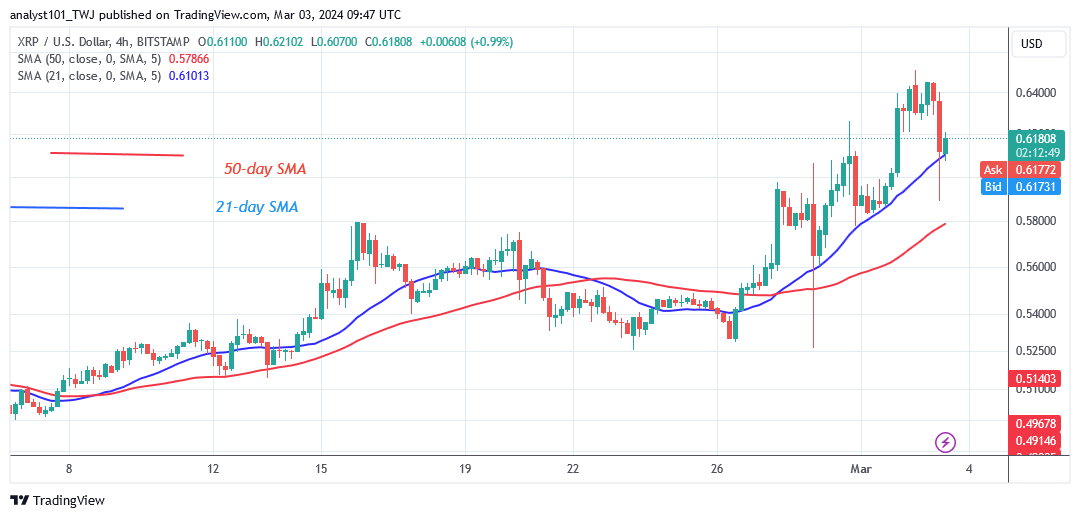
XRP’s (XRP) price has rebounded above the moving average lines but failed to surpass the $0.64 high. The cryptocurrency rose but was capped at its historical price of December 25, 2023, which is $0.64986. The crypto has not surpassed its most recent high since December 25, 2023. Nonetheless, if buyers break through this level, the market will rally to the $0.69 and $0.75 price levels.
On the downside, XRP fell to a low of $0.58 and then recovered. The altcoin is currently trading at $0.61 as of this writing. The current uptrend will resume if the altcoin retraces and remains above the current support or 21-day SMA. However, if the bulls fail to break through the barrier at $0.64, the altcoin will remain range bound, above the moving average lines but below the resistance.
Technical Indicators:
Major Resistance Levels – $1.00, $1.50, $2.00
Major Support Levels – $0.50, $0.30, $0.10
XRP (XRP) Indicator Analysis
Following the recent market rebound, the price bars are now above the moving average lines. On February 26, the altcoin had a bullish crossover, with the 21-day SMA crossing above the 50-day SMA. The positive signal will persist as long as the price bars are higher than the moving average lines.
What Is the Next Direction for XRP (XRP)?
The cryptocurrency has dropped above the 21-day SMA as it fails to surpass the $0.64 high. The crypto’s price returned above the 21-day SMA, indicating a further upward trend. The crypto signal is expected to be favorable, as the altcoin remains above the 21-day SMA and continues to rise.
You can purchase crypto coins here. Buy LBLOCK
Note: Cryptosignals.org is not a financial advisor. Do your research before investing your funds in any financial asset or presented product or event. We are not responsible for your investing results