XRP (XRP/USDT) Approaches Key Zone After Healthy Market Pullback
Estimated Reading Time: 3 minutes
Don’t invest unless you’re prepared to lose all the money you invest. This is a high-risk investment and you are unlikely to be protected if something goes wrong. Take 2 minutes to learn more
XRP/USDT Long-term Analysis: Ranging
After a long-time bullish rally, the overall sentiment for XRP against the Tether remains cautiously bullish, with recent price action suggesting a broad consolidation phase.
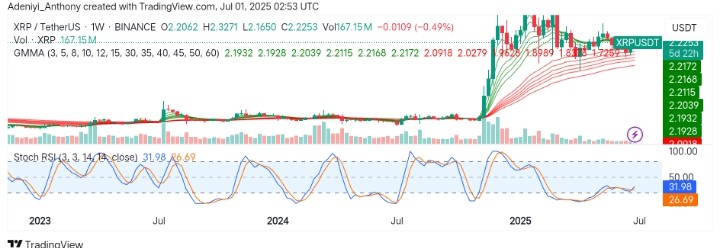
As it stands, the price is now stabilizing just above $2.2062 after testing lower levels in the recent session. However, market participants are now watching for signs of strength as the current weekly move shows a rebound from support with Stochastic RSI now recovering from oversold territory.
Currently, XRP trades at $2.2253, with over 167 million in traded volumes for the week so far.
Technical Indicators
Major Resistance Levels: $2.3000, $2.3800, and $2.6000
Major Support Levels: $2.0279, $1.8989, and $1.7259
XRP Technical Analysis
On the weekly chart, the analysis of XRP against the Tether still maintains a bullish structure despite recent short positions, as the short-term EMAs remain above long-term EMAs.
However, the recent decreasing volume on pullbacks suggests weak bearish pressure as the Stochastic RSI is seen recovering from the oversold zone, indicating an upcoming bullish impulse.
To this end, a close above the current level with the momentum oscillator crossing above the 50-mark level would confirm a continued bullish move; otherwise, a break below $2.0000 might invalidate this move.
XRP/USDT Analysis: What’s Happening?
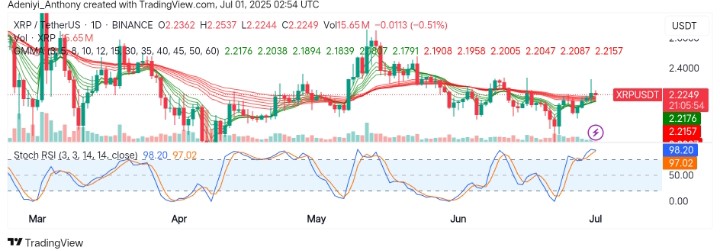
On the daily timeframe, XRP/USDT recently broke above the GMMA cluster, indicating short-term bullish pressure. However, the price is hovering at $2.2200, just above dynamic support from short EMAs, suggesting minor bullish dominance.
From another, the Stochastic RSI is heavily overbought (98.20 & 97.02), hinting at a short-term pause or pullback as the volume shows a lack of strong conviction.
To this end, a minor correction could retest $2.1800 before the next leg up towards $2.3800. Conversely, a drop beyond this level might give room for bearish dominance.
You can purchase crypto coins here. Buy LBlock