XRP (XRP/USDT) Eyes Breakout as Momentum Oscillator Nears Oversold Region
Estimated Reading Time: 3 minutes
Don’t invest unless you’re prepared to lose all the money you invest. This is a high-risk investment and you are unlikely to be protected if something goes wrong. Take 2 minutes to learn more
XRP/USDT Long-term Analysis: Bullish
The market for XRP against the Tether has been trading sideways following the surge in the early part of 2025. However, the market appears optimistic as the price hovers above a critical exponential moving average of the Guppy Multiple Moving Average (GMMA), signaling bullish interest is still alive.
Recently, the candle formation revealed indecision in the market with shrinking volumes, indicating a minor loss of momentum. However, the Stochastic RSI is approaching the oversold region, hinting that the pair may be nearing a potential bounce in the near term.
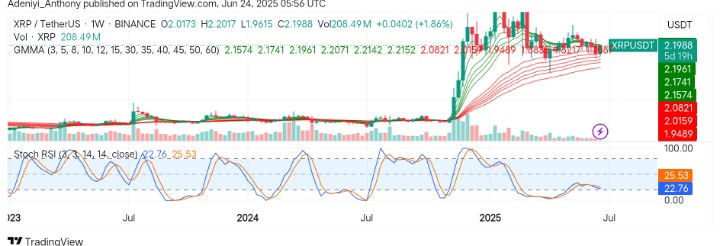
Currently, XRP trades at $2.1988, recording over 200 million traded volumes for the week.
Technical Indicators
Major Resistance Levels: $2.2100, $2.3200, and $2.5000
Major Support Levels: $2.0821, $2.0159, and $1.9489
XRP Technical Analysis
On the weekly timeframe, XRP against the Tether moves within a close range-bound movement, oscillating slightly above the $2.000 level. However, the price appears to be riding between the set of EMAs while maintaining a bullish structure, but recent bends in the short-term EMAs suggest a reversal might be seen once confirmed.
From another view, the Stochastic RSI indicates the pair appears to be operating in the oversold region, suggesting a renewed bullish strength provided price action confirms the shift.
To this end, the pair may need to hold above $2.0821 support for an upside movement toward $2.2100; otherwise, a dip below the current support line may signal the formation of a new low.
XRP/USDT Analysis: A Mid-Term Consolidation or Uptrend Continuation?
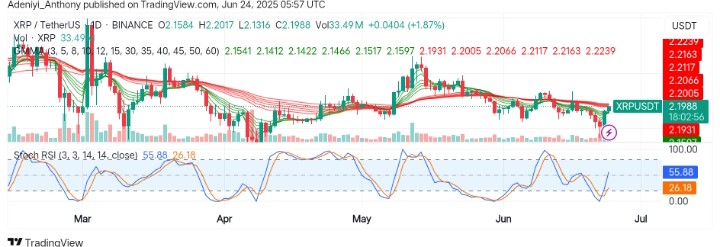
On the daily chart, the crypto pair XRP/USDT has recently rebounded near $2.1300 and is currently at $2.1988 with a minor gain of 1.87%. However, the Stochastic RSI is displaying a bullish crossover, signaling continued bullish momentum.
From another angle, the volume suggests increasing participation. However, a surge in the buying volume would strengthen the bullish case.
To this end, a bullish breakout could be confirmed if the pair’s price clears the immediate resistance at $2.2200 convincingly; otherwise, range-bound activities may be spotted.
You can purchase crypto coins here. Buy LBlock