Lucky Block Price Prediction: LBLOCK/USD Ranges as More Buyers Are Expected to Come into Focus
Estimated Reading Time: 2 minutes
Don’t invest unless you’re prepared to lose all the money you invest. This is a high-risk investment and you are unlikely to be protected if something goes wrong. Take 2 minutes to learn more

Free Crypto Signals Channel
The Lucky Block price prediction will remain above the moving averages for the coin to touch the nearest resistance level of $0.0025.
LBLOCK/USD Medium-term Trend: Bearish (4H Chart)
Key Levels:
Resistance levels: $0.0030, $0.0032, $0.0034
Support levels: $0.0020, $0.0018, $0.0016
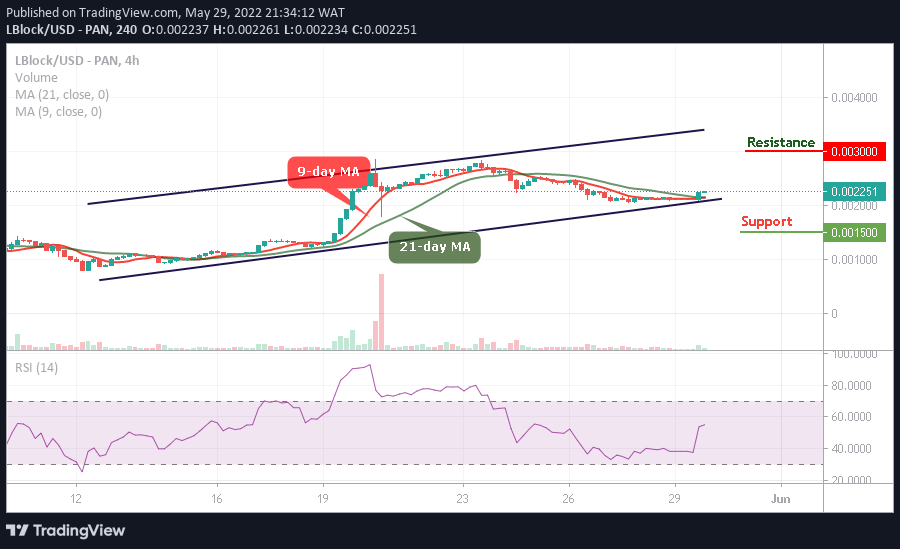
LBLOCK/USD is ranging as the market price moves above the 9-day and the 21-day moving averages. However, the market becomes cheaper so that new buyers could enter the market. Should the bulls fail to push the price upward, the Lucky block price will create an additional low before moving to the upside.
Lucky Block Price Prediction: LBLOCK/USD Will Touch $0.0025 Level
The Lucky Block price will soon break above the upper boundary of the channel if the market price crosses above the resistance level of $0.0025. However, any further bullish movement may push the coin to the resistance levels of $0.0030, $0.0032, and $0.0034.
Moreover, the upward movement will be delayed if the bears cross below the lower boundary of the channel which could touch the support levels at $0.0020, $0.0018, and $0.0016. Meanwhile, the technical indicator Relative Strength Index (14) is moving to cross below the 60-level.
LBLOCK/USD Medium-term Trend: Ranging (4H Chart)
When compared on the 4-hour chart, the Lucky Block price would cross above the 9-day moving average to touch the major resistance level at $0.0026. However, if the buyers push the price above the upper boundary of the channel, higher resistance could be located at $0.0027 and above.
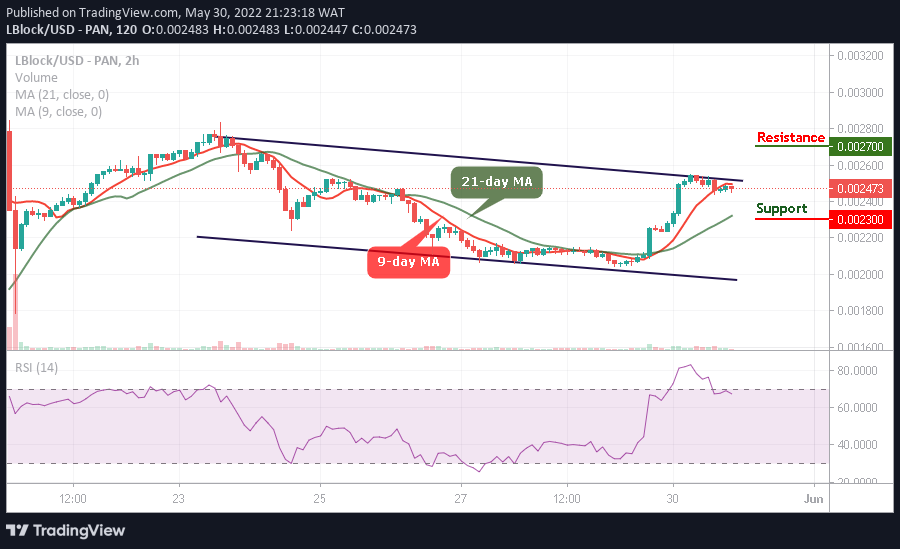
However, the technical indicator Relative Strength Index (14) is moving to cross above the 70-level, indicating that bullish signals are coming to play. Moreover, should the bulls fail to move the current market value above, the bears may step back into the market, and the nearest support level could be found at $0.0023 and below.
You can purchase Lucky Block here. Buy LBlock

