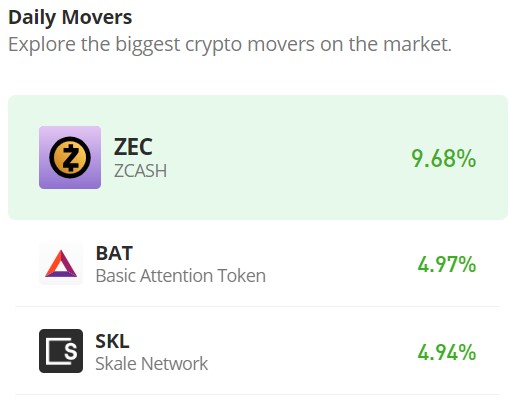
Zcash (ZEC/USD) Surges Past $30, Aiming for $45
Estimated Reading Time: 3 minutes
Don’t invest unless you’re prepared to lose all the money you invest. This is a high-risk investment and you are unlikely to be protected if something goes wrong. Take 2 minutes to learn more
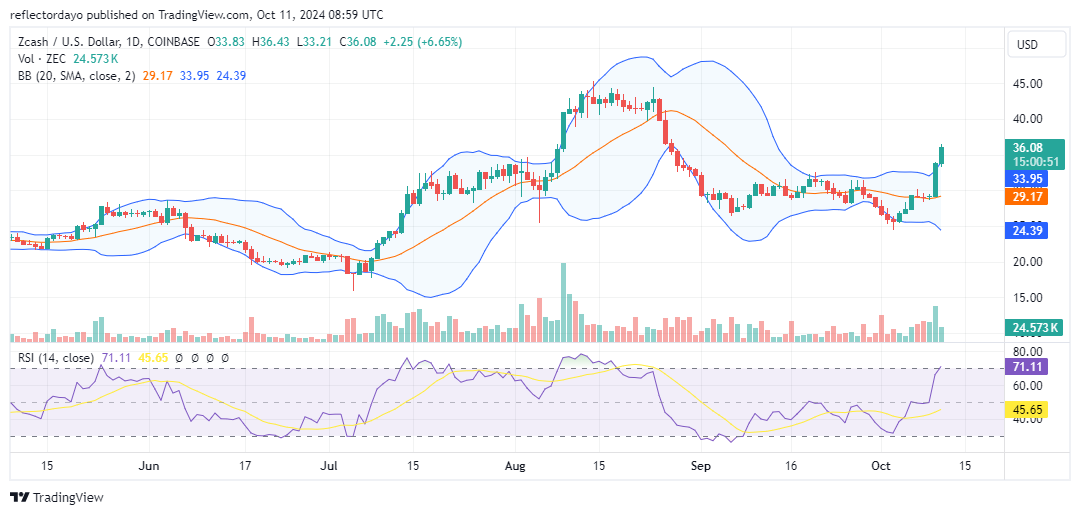
In August, Zcash (ZEC/USD) reached a peak of $45 following a series of unsuccessful attempts to break through this resistance level. This indecision signaled a potential crossroads for the market, with consolidation or reversal as possible outcomes.
Ultimately, bearish pressure prevailed, driving the price down to approximately $30, where renewed buying interest emerged. This consolidation phase continued throughout September. However, in October, after a period of sideways trading near the $30 equilibrium level, the market experienced a bullish breakout, surpassing the $35 price level.
Zcash Market Data
- ZEC/USD Price Now: $36.08
- ZEC/USD Market Cap: $583 million
- ZEC/USD Circulating Supply: 16.3 million
- ZEC/USD Total Supply: 16.3 million
- ZEC/USD CoinMarketCap Ranking: #105
Key Levels
- Resistance: $40.00, $45.00, and $50
- Support: $30.00, $25.00, and $20.00.
Zcash Market Through the Lens of Indicators
The Zcash market experienced a significant bullish surge yesterday, with buying pressure driving prices from approximately $29.33 to higher levels. This upward movement was accompanied by increased market volatility, which bullish traders could potentially exploit to secure stronger support levels.
Today’s technical indicators remain generally positive, with a bullish candlestick pattern and the upper Bollinger Band indicating strong upward momentum. However, the trading volume has decreased compared to previous sessions, possibly due to an overbought condition as measured by the Relative Strength Index (RSI). The RSI reading of 71 suggests that a short-term correction may be necessary to alleviate overbought conditions.
While a potential correction cannot be ruled out from this crypto signal, continued buying pressure and a potential increase in trading volume could fuel further gains and drive the price towards the $40 level.
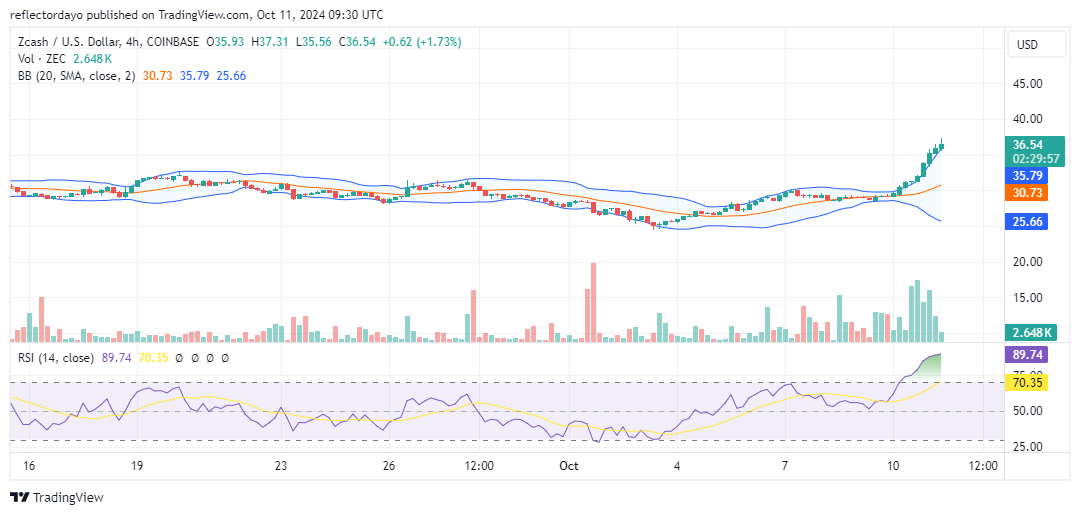
ZEC/USD Price Prediction: 4-Hour Chart Analysis
While the ZEC market remains predominantly bullish, there are signs of a potential short-term correction emerging. A closer look at the 4-hour chart reveals a slowdown in bullish momentum, possibly due to profit-taking activity. The extended upper shadow on the candlestick following the break above $35 suggests that sellers may be becoming more active.
Although the overall bullish sentiment remains strong, the market’s overbought condition and potential profit-taking could lead to increased volatility, as evidenced by the widening Bollinger Bands. While bulls currently maintain control, a significant resistance level, such as $40, could trigger a sharp correction that could erode recent gains.