Zksync (ZK/USDT) Approaches Key Support Zones as Selling Pressure Wanes
Estimated Reading Time: 3 minutes
Don’t invest unless you’re prepared to lose all the money you invest. This is a high-risk investment and you are unlikely to be protected if something goes wrong. Take 2 minutes to learn more

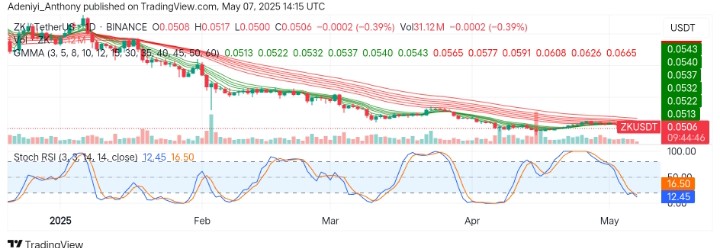
The market for Zksync against the Tether reflects a market trending to the south since the close of last year, with recent price actions breaking below several support levels. However, the price is currently hovering above a strong support as selling strength reduces.
As it stands, the behavior of the momentum oscillator indicates the pair is oversold with a recent failed bullish crossover attempt. However, the current position of the pair suggests a potential bounce or a short-term relief might be near, as the price action hints at a movement towards the $0.0537 resistance level.
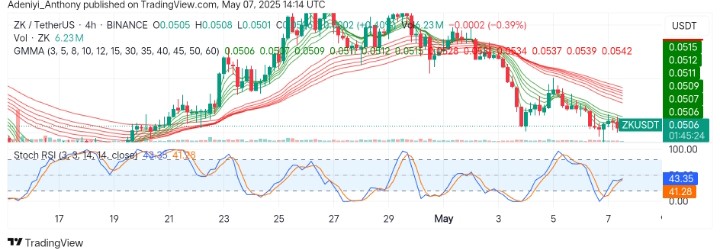
Currently, ZKsync trades at $0.0506, recording 31.12 million traded volumes for the day.
Technical Indicators
Major Resistance Levels: $0.0537, $0.0608, and $0.10000
Major Support Levels: $0.0500, $0.0400, and $0.03000
ZKsync Technical Analysis
On the daily timeframe, Zkysnc against the Tether has been on a consistent downtrend, forming lower lows and highs as it proceeds further south. However, all the EMAs constituting the Guppy Multiple Moving Averages (GMMAs) appear fanned out, suggesting the market is still dominated by the bears.
Beneath the chart lies the Stochastic RSI, which shows the pair is oversold, suggesting a bounce may be upon the market as the volume sees slight. If the pair’s price needs to break above $0.05037 in the coming session may be the start of recovery to the north; otherwise, there will be more southbound movement.
ZK/USDT Analysis: What’s next?
On the 4H chart, ZK/USDT is currently navigating a recovery zone after a strong bearish retracement earlier. However, the overall market still retains a bearish structure, as evidenced in the positioning of the short-period EMAs under the long-period EMAs despite a noticeable shift in momentum.
From another angle, the oscillator appears to be improving from the oversold region, suggesting a reliable upside movement with the formation of a double bottom and increasing trading volume.
To this end, a break above $0.0528 would confirm another reversal attempt to the north; otherwise, failure to hold above the current level might shift the price further to the south.
You can purchase crypto coins here. Buy LBlock