Zksync (ZK/USDT) Bearish Traders Resume Activities
Estimated Reading Time: 3 minutes
Don’t invest unless you’re prepared to lose all the money you invest. This is a high-risk investment and you are unlikely to be protected if something goes wrong. Take 2 minutes to learn more

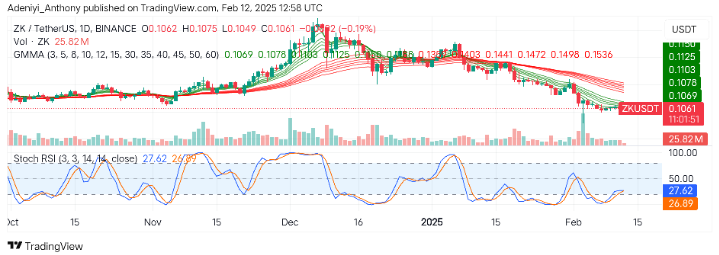
The market for Zksync against the Tether has seen a prolonged downtrend in recent trading periods as the price forms a series of lower lows. However, since its recent peak around $0.1200, the pair has been showing a clear sign of a downtrend.
To this end, recent price action around the Guppy Multiple Moving Averages (GMMAs) and the Stochastic RSI suggest the pair may extend its move to the south, as the bearish activities increase.
Currently, ZK/USDT trades at $0.1061 with over 25 million traded volumes for the day.
Technical Indicators
Major Resistance Levels: $0.1359, $0.1441, and $0.1536
Major Support Levels: $0.1050, $0.1020, and $1.000
Zksync Technical Analysis
On the daily timeframe, the analysis for ZKsync against the USDT is acting under strong selling pressure as the chart above captures an extended downtrend with several downward-sloping moving averages.
The GMMAs reveal a bearish momentum with the sustained bearish crossover signal. However, the volume has shown occasional spikes, suggesting strong sell-offs at key points. This indicates a bearish dominance, as bullish strength wanes.
On the other hand, the Stochastic RSI operates in the oversold region, picturing the market momentum. However, this may suggest current dominance is ending, but with the potential bearish crossover ahead, the pair may experience a further downtrend.
To this end, the pair’s price may see further movement towards $0.1020, except a bullish crossover is sighted.
ZK/USDT Analysis: Improvement to the North or a continued downtrend?
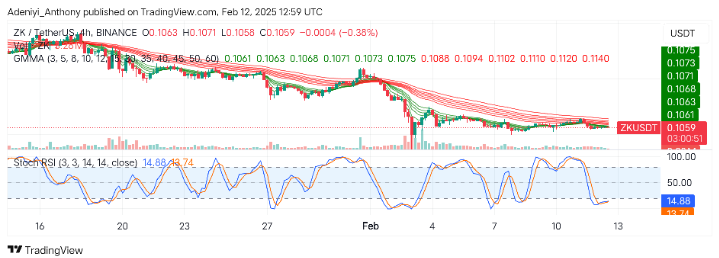
On the 4-hour timeframe, the analysis of ZK/USDT shows a mixed sentiment as the current trend shows signs of a reversal despite market conditions.
The GMMAs are still showing a strong bearish sentiment, with the short-period EMAs operating underneath the long-period EMAs.
The Stochastic oscillator, on the other hand, signals the pair is in an oversold region. However, the lines below the 20-mark level are displaying a sign of a bullish crossover, suggesting the pair is poised for short-term movement to the north.
To this end, a reversal would be possible if the price breaks above $01.075; otherwise, the downtrend continues.
You can purchase crypto coins here. Buy LBlock