Zksync (ZK/USDT) Consolidates Near $0.0853 Critical Level
Estimated Reading Time: 3 minutes
Don’t invest unless you’re prepared to lose all the money you invest. This is a high-risk investment and you are unlikely to be protected if something goes wrong. Take 2 minutes to learn more

The market for Zksync against the Tether has been experiencing a downtrend with touches of sideways movement since the beginning of the year. However, the pair appears to be showing signs of potential accumulation after an extended downtrend period.
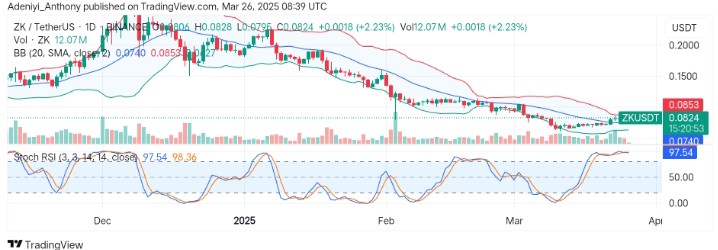
Recently, ZKsync’s value has been in a consistent fall with several failed attempts at stabilizing it. This is evident in the formation of several lower lows. However, current price action suggests selling pressure is waning as the price positioned near the upper Bollinger band at $0.0853. This reflects a 2.23% increase above the previous trade session.
Currently, Zksync trades at $0.0824, with 12.07 million traded volumes already.
Technical Indicators
Major Resistance Levels: $0.0853, $0.1000, and $0.1200
Major Support Levels: $0.0740, $0.0700, and $0.0600
Zksync Technical Analysis
The analysis of Zksync against the Tether shows that the pair is currently at a crucial point where it could either establish a trend reversal or continue the downtrend.
On the other hand, the Stochastic RSI indicates the pair may experience short-term bullishness. However, the operation of the lines at the 90-mark level raises the possibility of a minor correction before the continued uptrend.
To this end, a spike in the volume in the near term would determine a move above the $0.0853 for a trend reversal or a fall below the immediate support for a continued fall in price.
ZK/USDT Analysis: What’s Next?
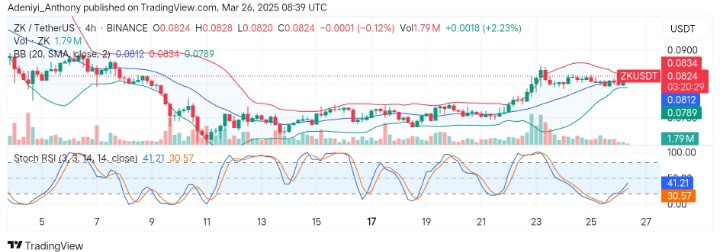
On the 4H chart, ZK/USDT shows a consolidation phase near the $0.0824 level. This was seen after experiencing a slight upside movement. However, the bands are coming together, suggesting an impending big move in the near term. Additionally, with the $0.0812 mid-band line acting as the dynamic support, the pair may break above $0.0900 soon.
The Stochastic RSI, on the other hand, signals the pair is recovering, hinting at a short-term potential bullish movement. However, the volume is relatively low. This signals a need for more buying power.
To this end, if momentum is sustained, a breakout above the upper limit would materialize; otherwise, a fall below $0.0812 would lead to a retest of $0.0789, the support line.
You can purchase crypto coins here. Buy LBlock