BNB (BNB/USDT) Poised for More Short-term Gains
Estimated Reading Time: 3 minutes
Don’t invest unless you’re prepared to lose all the money you invest. This is a high-risk investment and you are unlikely to be protected if something goes wrong. Take 2 minutes to learn more
BNB Long-term Analysis: Bullish
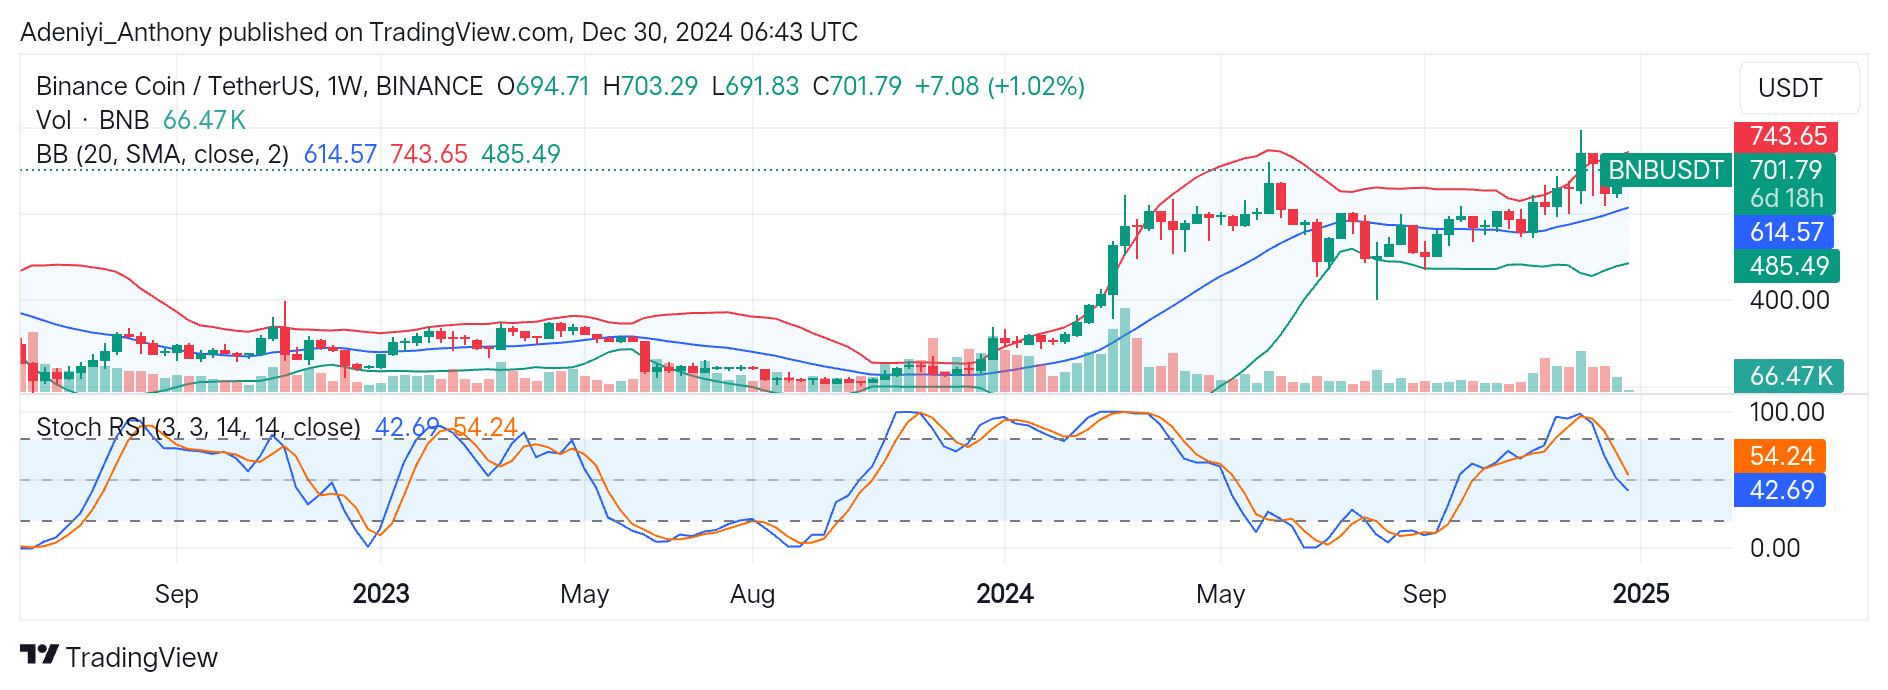
The overall market sentiment for BNB against the Tether on a weekly timeframe reveals bullish momentum, as the pair sees a steady rise in price after a recent consolidation phase.
The recent upward movement suggests a recovery process at $743.65 after dipping toward $614.57. However, the placement of the pair and the positioning of the Stochastic RSI indicate caution despite aiming for further gains.
Currently, BNB is trading at $701.79, with over 66 thousand weekly traded volumes and over 1.02% above the previous trading session.
Technical Indicators
Major Resistance Levels: $710.00, $743.65, and $800.00
Major Support Levels: $650.00, $614.57, and $485.49
BNB Technical Analysis
The weekly analysis of BNB against the USDT shows the pair is on a bullish trend with slight upward momentum, as the pair’s price nears the upper Bollinger band at $743.65. This may indicate an upside movement, but as overextension looms, the midline at $614.57 may serve as a dynamic support in the short term.
Moreover, the Stochastic RSI indicates that the BNB/USDT is in a neutral position with the lines pointing to the south. This suggests a reduced bullish momentum. However, for an upside movement, the lines need to improve above the 60-mark level, as further dips would indicate a short-term correction.
BNB/USDT Analysis: Expectations
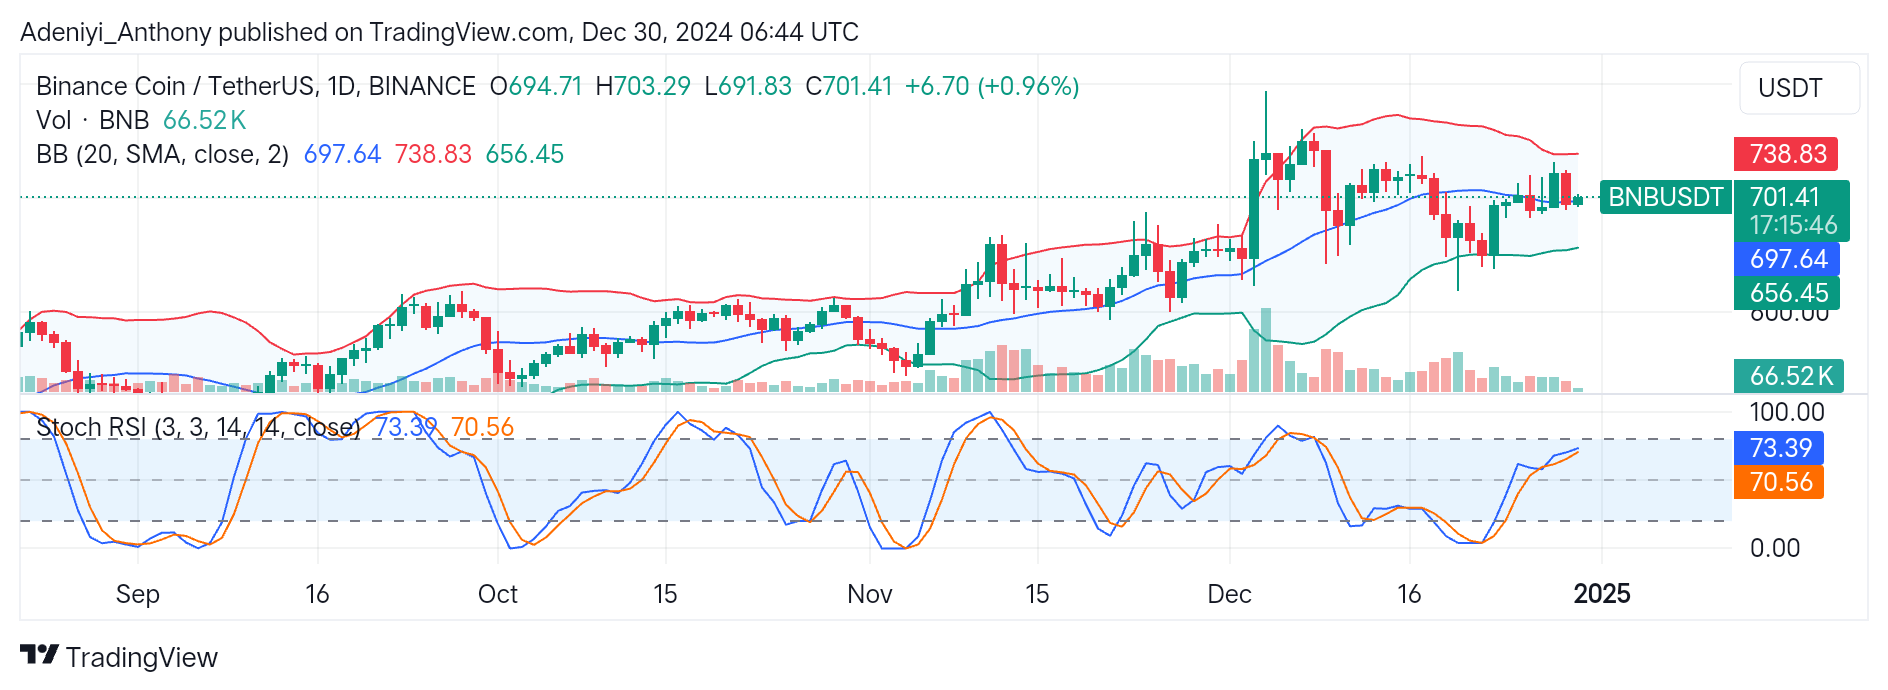
On a daily timeframe, BNB/USDT appears to be trending slightly upward after recent range-bound activities around the dynamic 20-period SMA. However, recent price movement suggests the pair aims at $738.83, as the Bollinger Bands signal impending market volatility.
Also, the Stochastic oscillator at the bottom of the chart suggests potential exhaustion of the current upside movement as the lines read above the 70-mark level.
To this end, a bullish continuation is possible if the price breaks above $703.29 or $705 with increasing trading volumes; otherwise, a reversal or a short-term pullback is possible with a breakdown below the mid-line at $697.64.
You can purchase crypto coins here. Buy LBlock