Zksync (ZK/USDT) Faces Extended Pressure from Bearish Traders
Estimated Reading Time: 3 minutes
Don’t invest unless you’re prepared to lose all the money you invest. This is a high-risk investment and you are unlikely to be protected if something goes wrong. Take 2 minutes to learn more
The market for Zksync against the Tether remains cautiously relieved after some period of extended downtrend. The price has shown persistent bearish pressure, as seen in the price action below key Moving Averages Ribbons.
Recent consolidation and the oversold signal on the Stochastic RSI suggest the pair might see a short-term bounce or an extended relief soon. However, with the selling pressure slowing down and volume increasing, can the oversold condition spark a relief rally?
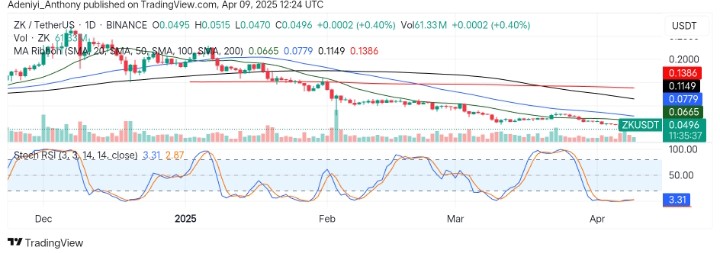
Currently, Zksync trades at $0.0496, with over 60 million traded volumes for the day already.
Technical Indicators
Major Resistance Levels: $0.0665, $0.0779, and $0.1149
Major Support Levels: $0.0470, $0.0450, and $0.0380
Zksync Technical Analysis
The analysis of the Zksync against the Tether on the daily timeframe shows the pair is in a deep downtrend, breaking below key moving averages as the bullish traders expect a bounce play above the 20 simple moving averages soon.
The Stochastic oscillator, on the other hand, signals an extremely oversold condition. However, the flattened lines hints at a possible reversal is on the horizon but the trend remains bearish as the price prepares to face to face a strong resistance level at $0.0665.
To this end, with an increasing volume, traders should watch out for a confirmed bullish reversal above $0.0665; otherwise, a pause in momentum might lead to continued downtrend.
ZK/USDT Analysis: Will the Oversold Signal Spark a Relief Rally?
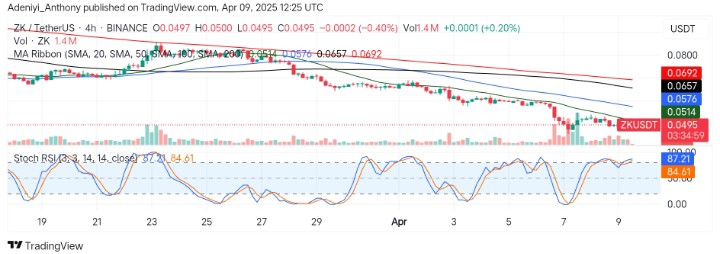
On the 4h chart, ZK/USDT shows a temporary relief as the price consolidates near the $0.0500 level, but is still stationed under the moving average ribbons. However, the paused volume suggests a weak bullish follow-through as the price fails to break above immediate resistance level set by the 20 SMA.
From another angle, the oscillator signals an overbought condition, indicating exhaustion and a possible continuation of the recent trend in view.
To this end, a rejection at the current level would signal the continuation of the previous trend. Conversely, a break above the $0.0514 with an increasing volume would indicate the start of a reversal.
You can purchase crypto coins here. Buy LBlock