BNB (BNB/USDT) Struggles to Break Above $654 Dynamic Level
Estimated Reading Time: 2 minutes
Don’t invest unless you’re prepared to lose all the money you invest. This is a high-risk investment and you are unlikely to be protected if something goes wrong. Take 2 minutes to learn more
BNB Long-term Analysis: Ranging
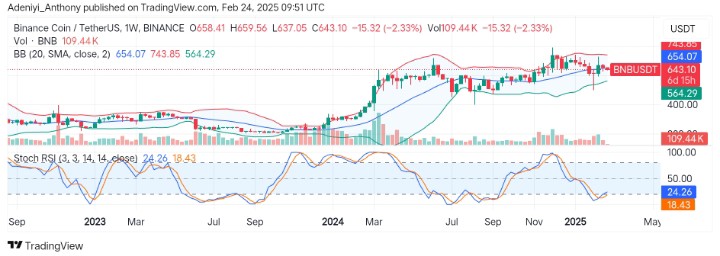
The market for BNB against the Tether has experienced a strong bullish trend in some sessions before now, leading to the formation of a new high. However, due to the intensified selling pressure, BNB/USDT has retraced below the $658 critical level, ranging between tight levels as traders await a breakout or further correction to the south.
Currently, BNB is trading at $643.10, recording a 2.33% loss on the weekly timeframe, with over 109 thousand traded volumes.
Technical Indicators
Major Resistance Levels: $675.00, $700.00, and $743.85
Major Support Levels: $600.00, $564.00, and $540.00
BNB Technical Analysis
On the weekly timeframe, BNB against the Tether has shown a decline from the $743 level, after which it moves sideways around the mid-Bollinger band, indicating neither the bulls nor the bears are in control of the market.
However, recent price actions suggest movements to the south, but the Stochastic RSI indicates an impending northbound movement as the lines point upward.
To this end, a break above $654 would signal a move toward $700; otherwise, a continued correction will materialize with a break below $630.
BNB/USDT Analysis: Breakout to Which Side?
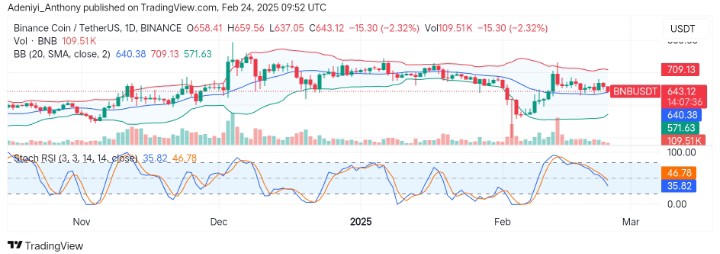
On the daily chart, BNB/USDT has experienced a strong sell-off followed by a sideways movement. However, the $640 dynamic support line seems to be acting strong as the price points to the south, indicating the presence of bearish traders.
On the other hand, the Stochastic oscillator signals further correction, with the lines placed below the 50-mark level, approaching the oversold region.
To this end, if the price drops below $640, a move towards $517 is likely going to materialize. Conversely, if momentum is strengthened with a move above $660, it could propel the pair towards $709 in the near term.
You can purchase crypto coins here. Buy LBlock