Chainlink (LINK/USDT) Fails to Hold Above $15.82 Critical Level
Estimated Reading Time: 3 minutes
Don’t invest unless you’re prepared to lose all the money you invest. This is a high-risk investment and you are unlikely to be protected if something goes wrong. Take 2 minutes to learn more

Chainlink Long-term Analysis: Bearish
The market for chainlink against the Tether has experienced a strong drop in price after hitting a local peak at the $25.00 level. Since then, the pair has been trending to the south, trading below the 20-period and 50-period moving averages.
Recently, the price has faced strong resistance, retracing 15.23% while hovering just above the 200-period moving average line. To this end, the pair may experience a bearish continuation, and a downside towards $13.00 may be recorded. However, the appearance of the Stochastic RSI shows that the price may rebound in the near term.
Currently, Chainlink trades at $14.83, with over 35 million traded volumes.
Technical Analysis
Major Resistance Levels: $15.82, $17.75, and $18.97
Major Support Levels: $14.27, $13.31, and $12.00
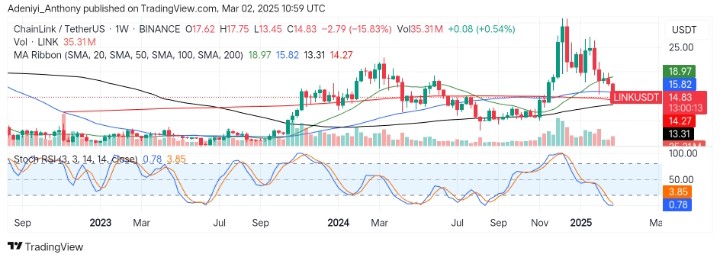
Chainlink Technical Analysis
The analysis of the Chainlink against the Tether on a weekly timeframe shows that the pair has been trending downward. The price actions around the moving average ribbons show that the pair is struggling to hold above a major level. However, a move below the $14.27 support level may confirm further downside.
On the other side, the Stochastic oscillator indicates the pair operates in an extremely oversold region with signs of shifting to the front, showing the market lacks participation.
To this end, the price may not make a significant move in weeks to come, except if there is a surge in volume. However, the market remains in a downtrend.
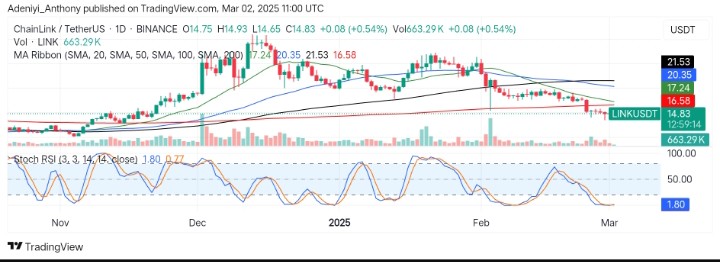
LINK/USDT Analysis: Where from Here?
On the daily timeframe, LINK/USDT is in a strong downtrend, with price trading below the moving average ribbon. This shows the pair is under strong selling pressure as the bears keep pushing the price to the south.
However, at the bottom of the chart, the oscillator shows that current momentum is waning, suggesting a short-term bounce may be seen in the near term, provided bullish traders take the necessary action.
To this end, links remain in a downtrend, and it may continue if the $14.50 support level fails. Conversely, a break above $16.00 may materialize if the immediate support holds.
You can purchase crypto coins here. Buy LBlock