Ethereum (ETH/USDT) Shows Signs of Potential Reversal Amidst Market Conditions
Estimated Reading Time: 3 minutes
Don’t invest unless you’re prepared to lose all the money you invest. This is a high-risk investment and you are unlikely to be protected if something goes wrong. Take 2 minutes to learn more

Ethereum Long-term Analysis: Bearish
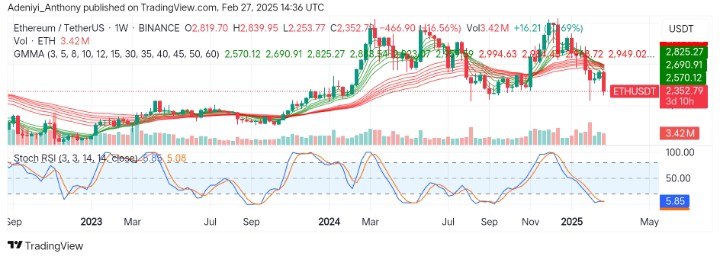
The market for Ethereum against the Tether on the weekly timeframe has attempted but failed at $2,900 resistance. This can be described by the continuous fall in price despite expectations by the bullish traders. The Ethereum market has experienced heavy selling pressure and volume in recent times, indicating a shift in market sentiment as the Guppy Multiple Moving Averages (GMMAs) signal a bearish crossover.
To this end, ETH displays signs of a potential upside movement with the appearance of the oscillator in an extremely oversold condition. However, more confirmation is needed.
Currently, Ethereum trades at $2,352.79, recording over 16% loss, with 3.42 million traded volumes.
Technical Indicators
Major Resistance Levels: $2,570, $2,825, and $2,900
Major Support Levels: $2,300, $2,100, and $2,000
Ethereum Technical Analysis
On the weekly timeframe, Ethereum seems to be oscillating after a sharp fall from the previous top, as the market records lesser market trading volumes. The GMMAs converge, signaling heightened selling pressure as the short-period EMAs fall under the long-period EMAs.
However, the Stochastic RSI at the bottom of the chart indicates price may stretch to the right in the meantime as the indicator warns of a pause in the downward pressure. To this end, bullish traders need to seize the moment to re-enter the market as the price lacks clear direction.
Therefore, a trade above the $2,500 level would rekindle bullish strength, while a fall below $2,300 would lead to further decline.
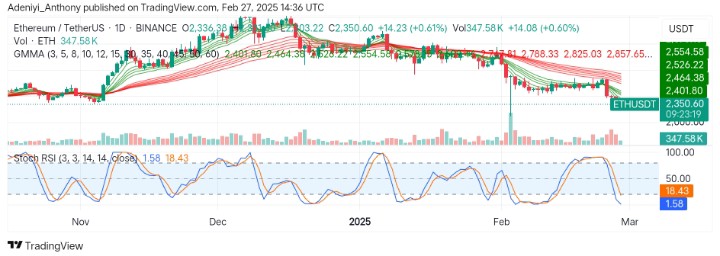
ETH/USDT Analysis: The Pair Records Minor Gains
On the daily timeframe, ETH/USDT records a little gain of 0.61% in trade position and 0.60% in trading volume as bullish traders take on the bears whose dominance has led to a prolonged downtrend.
However, the GMMAs still signal a bearish position; the lines of the Stochastic RSI suggest bearish pressure is waning as the blue line shows signs of a bullish crossover.
To this end, as more confirmation is expected, a break above $2,401.80 towards $2,464.38 would signal the start of a journey to the north.
You can purchase crypto coins here. Buy LBlock