Polkadot (DOT/USDT) Teeters Near a Critical Support Level
Estimated Reading Time: 2 minutes
Don’t invest unless you’re prepared to lose all the money you invest. This is a high-risk investment and you are unlikely to be protected if something goes wrong. Take 2 minutes to learn more
Polkadot Long-term Analysis: Bearish
The market of Polkadot against the Tether has been under heavy selling pressure over the last few months, dwindling to the south despite bullish efforts to prevent further downtrends.
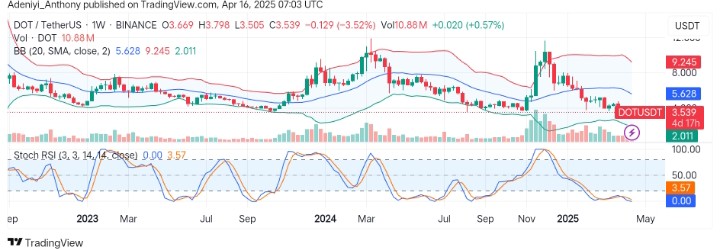
Recently, Polkadot has been hovering near a significant long-term support zone, hoping to break above $2.011 as the Stochastic RSI hints at a potential bounce despite Bollinger bands’ signal of a lack of bullish conviction.
Currently, Polkadot trades at $3.539, recording a moderate volume of 10.88 million and 3.52% losses for the week already.
Technical Indicators
Major Resistance Levels: $5.628, $6.806, and $9.245
Major Support Levels: $3.300, $3.000, and $2.011
Polkadot Technical Analysis
The Polkadot and Tether analysis on the weekly timeframe shows that the pair is currently bearish as the price operates in the lower segment of the Bollinger Bands, hoping to experience a bounce to the north due to the oversold condition of the Stochastic RSI.
However, the weekly volume recorded so far signals exhaustion, as the small-bodied candles with long wicks that are formed indicate hesitation from the traders.
To this end, a spike in the volume with the price at $4.785 would indicate bullish plans to push the price up north; otherwise, a continuation of the current trend will play out if the price dips below the current level.
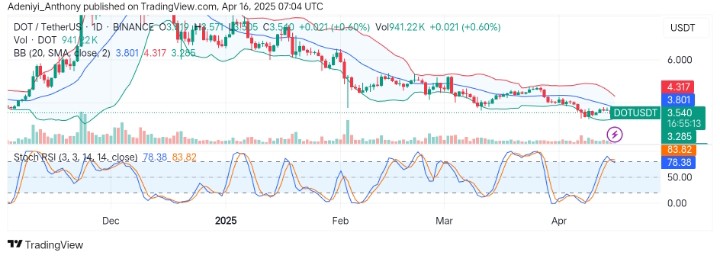
DOT/USDT Analysis: Where from Here?
On the daily timeframe, DOT/USDT trades at $3.540, indicating a 0.60% gain as the price sees strong support at the lower Bollinger band. However, the Stochastic RSI hints at a potential pullback as the volume shows neither accumulation nor distribution activities going on.
To this end, the short-term momentum is bullish, but the overbought oscillator’s condition and the resistance at $3.800 suggest caution is needed.
You can purchase crypto coins here. Buy LBlock

