XRP (XRP/USDT) Sees a Sharp Pullback After Recent Rally
Estimated Reading Time: 3 minutes
Don’t invest unless you’re prepared to lose all the money you invest. This is a high-risk investment and you are unlikely to be protected if something goes wrong. Take 2 minutes to learn more
XRP Long-term Analysis: Bearish
The market for XRP against the Tether has seen a significant pullback after peaking over the $2.1000 level. This retracement signals a mix of take-profit and consolidation phases. However, the general market sentiment reflects a cautious optimism, as the pair operates at the $2.000 level.
For a month, XRP against the Tether has seen a sharp drop after reaching a new height. Despite the decline, the pair has shown resilience above the $2.000 level. However, traders are closely watching key resistance and support, as reversal hinges on the potentiality to break above the $2.1237 level.
Currently, XRP is trading at $2.0745, with over 403 million weekly traded volumes.

Technical Indicators
Major Resistance Levels: $2.0808, $2.1237, and $2.1526
Major Support Levels: $1.9954, $1.9160, and $1.8010
XRP Technical Analysis
The analysis of XRP on the weekly timeframe shows that the price is facing short-term down pressure, as seen in the price’s position around the short-period EMAs. Though XRP/USDT faces the south, the divergence and the upside alignment of the long-period EMAs show renewed hope. To this end, a sustained move above $2.1237 would indicate a short-term recovery toward the previous high; otherwise, a break below the $2.000 level would suggest a further downtrend.
On the other hand, the Stochastic RSI suggests the pair still operates slightly in the overbought region, as the lines read 71.82 for orange and 60.78 for blue. However, this position suggests a price correction in the short term if a blue crossover occurs above the 50-mark level. Conversely, a dip below the 50-mark level may lead to a retest of lower support levels.
XRP/USDT Analysis: A Renewed Optimism
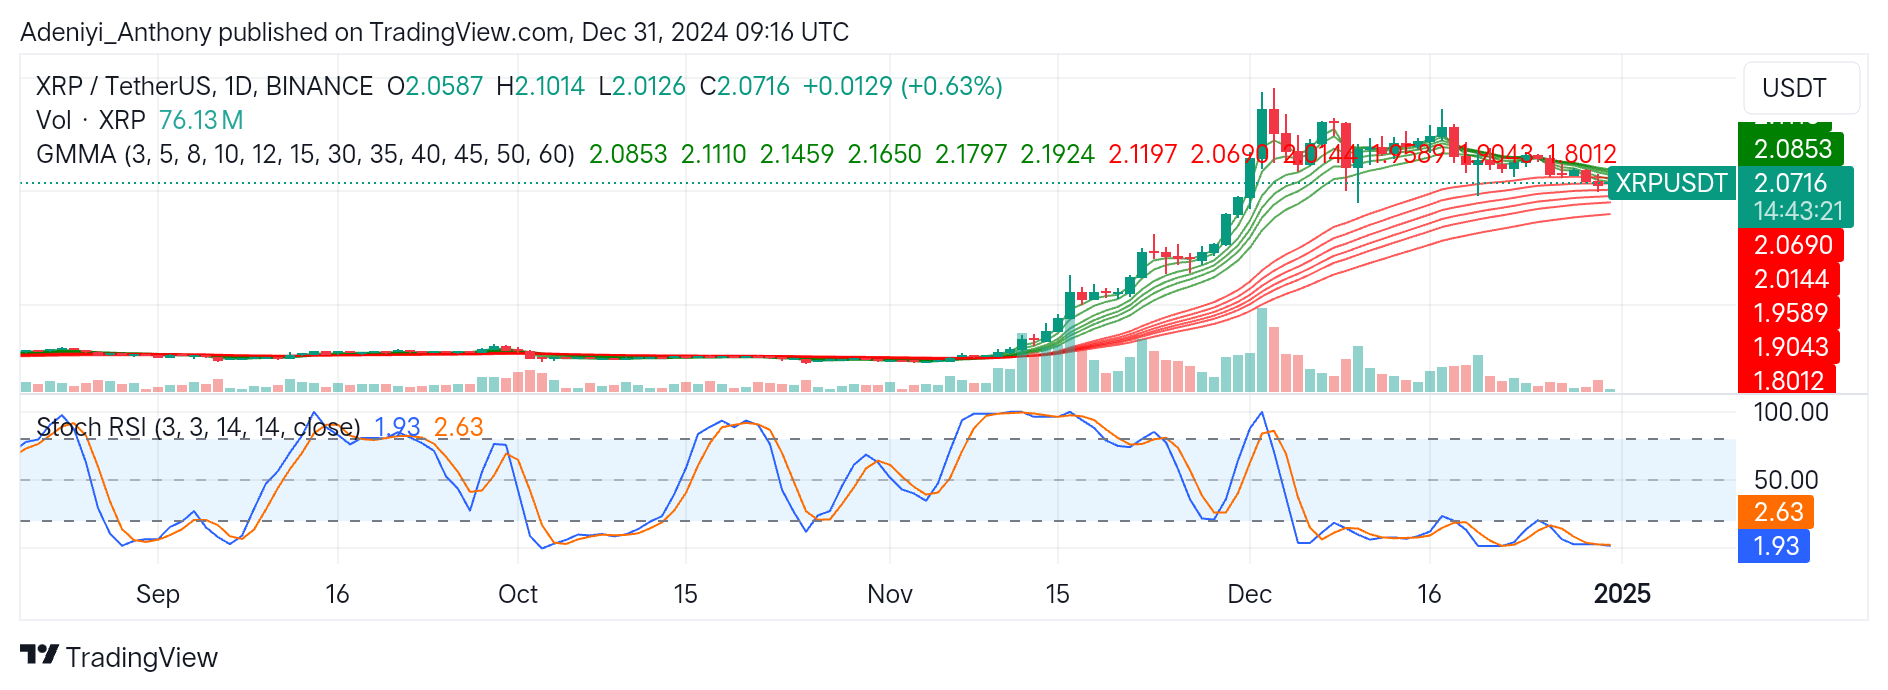
On the daily timeframe, XRP/USDT is currently consolidating, as the pair oscillates within a close range. The appearance of the price at $2.0853 above the short-term EMAs indicates renewed hope. However, the narrowing gap between the sets of EMAs suggests weakened momentum.
The oscillator at the bottom of the chart shows the pair operating in the oversold region, with a potential bounce on the horizon if momentum shifts bullish. To this end, increased trading volume with a currently bullish uptick would indicate an uptrend. However, failure to hold above the current level would signal a move towards $1.9589.
You can purchase crypto coins here. Buy LBlock