XRP (XRP/USDT) Shows Signs of Consolidation Before Breakout
Estimated Reading Time: 3 minutes
Don’t invest unless you’re prepared to lose all the money you invest. This is a high-risk investment and you are unlikely to be protected if something goes wrong. Take 2 minutes to learn more
XRP Long-term Analysis: Bullish
There has been a consistent tug-of-war in the market for XRP against the Tether, as the pair shows resilience, hovering above the $2.000 level despite fading momentum. However, the chart below displays a pullback after a significant rally towards the end of 2024. Right now, the market movement suggests a cooling period with the potential for another upside movement in view.
Recently, the market has been showing mixed signals as the price looks to break out from the current range-bound movement. To this end, the Stochastic RSI has bottomed out, hinting that bullish momentum could return soon if key levels are reclaimed.
Currently, XRP trades at $2.1446, recording over 168 million traded volumes for the week already.
Technical Indicators
Major Resistance Levels: $2.2252, $2.2800, and $2.8000
Major Support Levels: $2.1264, $1.8561, and $1.6230
XRP Technical Analysis
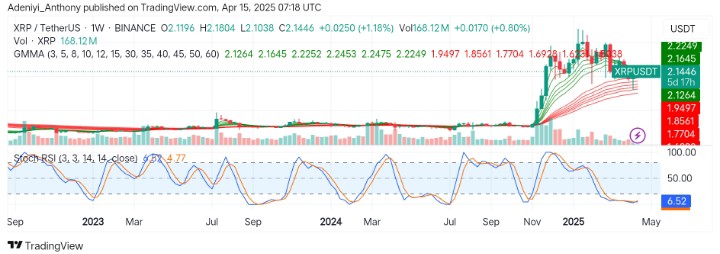
On the weekly timeframe, XRP against the Tether is currently in a consolidation phase following a parabolic run in the previous year. However, the price seems to be held in between the Guppy Multiple Moving Averages (GMMAs) as the struggle between the market participants continues.
From another angle, the Stochastic oscillator is deeply oversold, but the lines are preparing for a northbound movement, signaling a potential reversal if buyers step in. However, the volume is showing no significant spike, but the compressed GMMAs hint at a breakout in the near term.
To this end, a close above $2.2252 with increasing volume would signal trend continuation towards $2.8000; otherwise, the pair might continue to oscillate within the $1.8561 and $2.0000
XRP/USDT Analysis: Can the Bulls Regain Momentum?
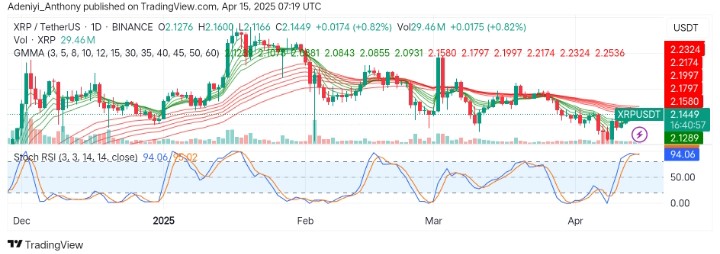
On the daily chart, XRP/USDT has reclaimed $2.1264 with a strong push from the bullish traders. However, the Stochastic RSI operates at 94, suggesting momentum is strong but may cool off or consolidate soon.
The GMMAs seem to be expanding, indicating a short-term strength as the volume picks up, confirming the recent bounce-off from previous support. However, immediate resistance lies at $2.1800 on the chart, with buyers stepping aggressively on the dip.
To this end, the short-term bias is bullish, but caution is needed as the oscillator signals an overbought condition.
You can purchase crypto coins here. Buy LBlock