Bitcoin Cash (BCH/USD) Market Appears Settling for Upside Motions
Estimated Reading Time: 3 minutes
Don’t invest unless you’re prepared to lose all the money you invest. This is a high-risk investment and you are unlikely to be protected if something goes wrong. Take 2 minutes to learn more
Bitcoin Cash Price Prediction – October 15
It’s probably shown in the BCH/USD financial book of records that the crypto market appears settling for upside motions. The crypto-economic price now trades around $625 at a positive percentage rate of 4.49. That is an added confirmation sign that buying pressure is in the loom.
BCH/USD Market
Key Levels:
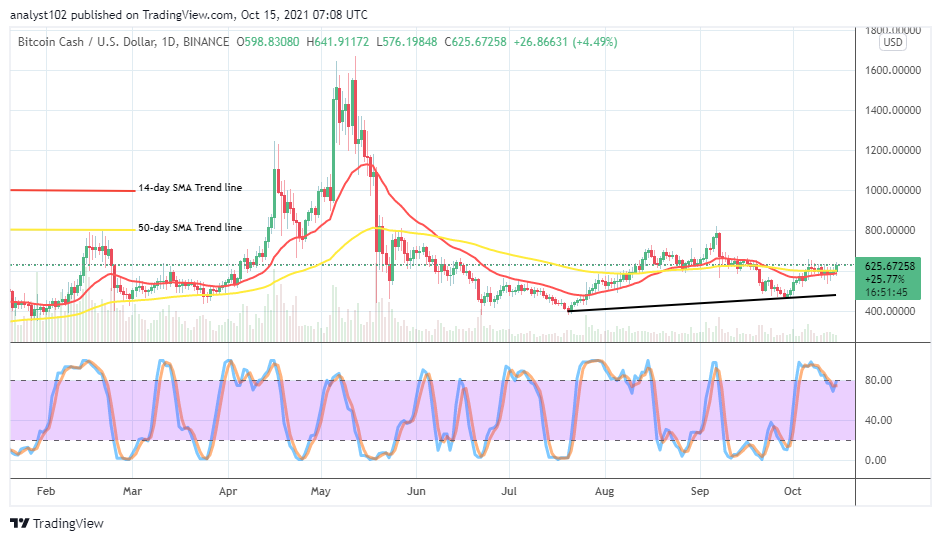
Resistance levels: $600, $800, $1,000
Support levels: $400, $300, $200
BCH/USD – Daily Chart
The daily chart reveals that the BCH/USD market appears settling for upside motions as it has not been too far from a lower trading zone it recently rallied. After a southward interception of the bigger indicator by the smaller indicator, the 14-day SMA trend line has currently curved northward, conjoining with the 50-day SMA trend line. The bullish trend line drew beneath them as a supportive tool. The Stochastic Oscillators have briefly bent southbound against the range line at 80. And they now attempt to cross the lines northbound closely underneath the range value line with a promising upward pressure returning soon.
Has there been a reliable buy sign in the BCH/USD business operations as the market appears settling for upside motions?
Going by a technical viewing point at a close range, it observed that the current BCH/USD trading outlook wears a promising-buying pressure to unveil soon as the crypto-economic market appears settling for upside motions. As it is on the chart, the emergence of a bullish candlestick is in the making to probably project the market activities for some northward forces.
At this point, the downside of the BCH/USD market may suspend for a while to know what can be the subsequent price reactions around the current trading zone. A low-active pull-up away from $625 may turn out to be a fake in no time to potentially allow bears to regain the market’s control once again. Traders going for shorting positions would as well have to do so with cautiousness for a while.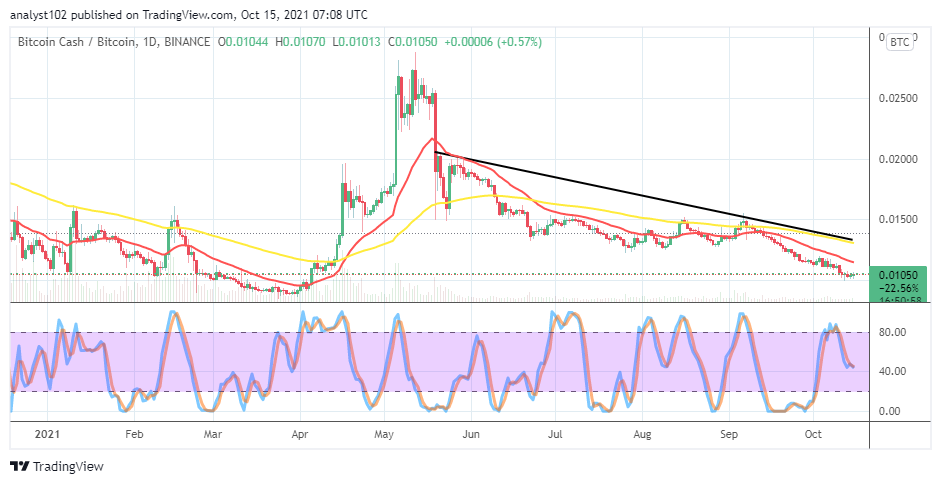
BCH/BTC Price Analysis
In comparison, Bitcoin Cash’s trading capability is under pressure inflicted on it by Bitcoin. In other words, the base crypto appears settling at a lower trading zone as paired with the counter crypto. The bearish trend line drew alongside the bigger SMA trend line at a smaller-lengthy extreme side. The 14-day SMA indicator is underneath the 50-day SMA indicator. The Stochastic Oscillators are a bit over the range of 40, seemingly trying to conjoin the lines to start a consolidation movement. That could cause a kind of recession trading situation between the two cryptocurrency pairing set-ups. That means neither the base crypto nor the counter crypto will have the market advantage against each other..
Note: Cryptosignals.org is not a financial advisor. Do your research before investing your funds in any financial asset or presented product or event. We are not responsible for your investing results.
You can purchase crypto coins here. Buy Tokens