Bitcoin Cash (BCH/USD) Trade Witnesses a Drop
Estimated Reading Time: 3 minutes
Don’t invest unless you’re prepared to lose all the money you invest. This is a high-risk investment and you are unlikely to be protected if something goes wrong. Take 2 minutes to learn more
Bitcoin Cash Price Prediction – September 10
The BTC/USD Trade operation witnesses a drop in its price valuation as it has occurred in many other crypto economies during the recent last couple of days. The crypto’s worth currently trades around the level of $660 at about a percentage rate of -0.18. That shows that the depression pace is on a note of getting reduction little by little.
BCH/USD Market
Key Levels:
Resistance levels: $800, $1,000, $1,200
Support levels: $500, $400, $300
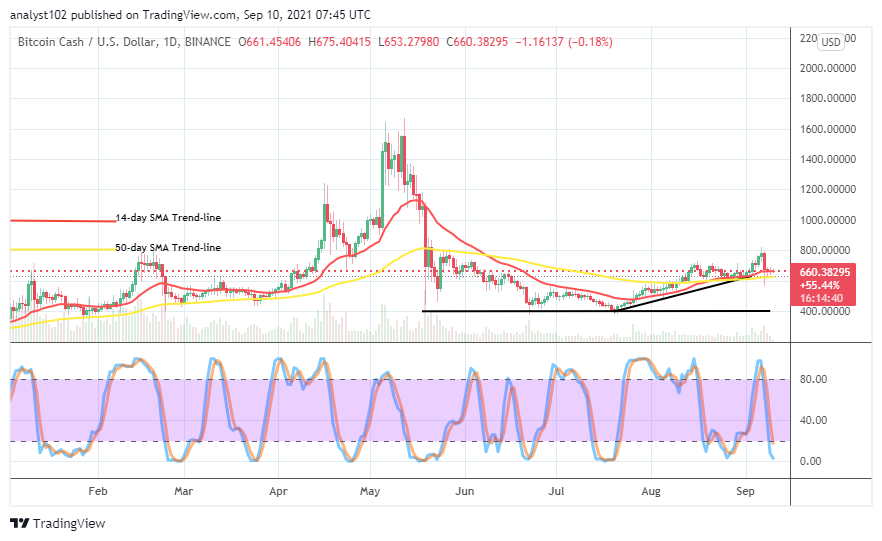
BCH/USD – Daily Chart
The BCH/USD daily chart depicts that the trade witnesses a drop in its valuation as it happened to several other crypto economies during the September 7th operation. The 14-day SMA trend-line is above the 50-day SMA trend-line. The bearish candlestick that emerged in the fateful volatile session slightly breached past the $600 line before shortly reverted on a lighter form. The Stochastic Oscillators have found their ways into the oversold region with a fresh appearance. That suggests that the dropping effect on the market is yet to be completely exhausted.
As the BCH/USD trade witnesses a drop, could there be sustainable dropping forces more?
It appears that the recent price depression in the BCH/USD trade operations will primarily be to allow bulls to reshape their position in the market. Therefore, sustainability of further dropping forces below $600 may not live long as the trade now witnesses a drop in its valuation. It would technically be wise that long-position-taking traders needed to be on the lookout for rebounding attempts that price tends to be making around the point earlier mentioned to re-launch their presence.
On the downside, the BCH/USD market bears in the first sense of placing a sell order at this point would have to be very cautious of their decisions as price could spike in no time again around the level of $600. The timely positioning of the Stochastic Oscillators in the oversold region suggests that the possibility of price not to go much more under a depressive force afterward.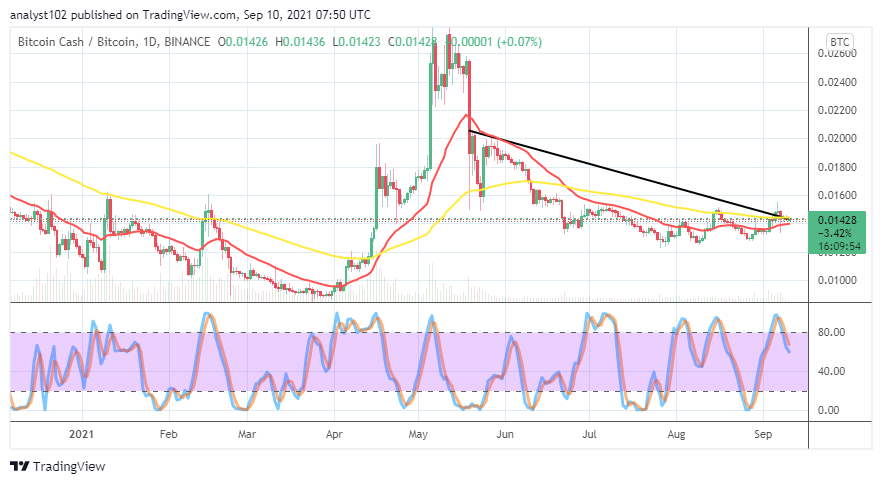
BCH/BTC Price Analysis
In comparison, Bitcoin Cash’s trending outfit pairing with Bitcoin appears yet not possessing strong-energy as the base crypto to push visibly to the upside. In the last couple of trading days’ activities, the currency pair trade also witnessed a drop at a lesser-high trading line around the bigger SMA trend-line. The 14-day SMA indicator is closely beneath the 50-day SMA indicator. The Stochastic Oscillators have slightly moved southbound from the overbought region, seemingly trying to cross the lines around the range of 60. That suggests that the depression forces have somewhat been exhausted close to an average point. As a result, BCH may continue trying to swing in a low-active motion against BTC in the following trending outlooks.
Note: Cryptosignals.org is not a financial advisor. Do your research before investing your funds in any financial asset or presented product or event. We are not responsible for your investing results.
You can purchase crypto coins here. Buy Tokens