Cardano (ADA/USDT) Poises for a Potential Breakout Near a Critical Level
Estimated Reading Time: 3 minutes
Don’t invest unless you’re prepared to lose all the money you invest. This is a high-risk investment and you are unlikely to be protected if something goes wrong. Take 2 minutes to learn more
Cardano Long-term Analysis: Ranging
In recent weeks, Cardano has faced significant volatility, but the pair appears to be consolidating near a critical level, with a setup reversal or continued downtrend as the Bollinger bands suggest an impending breakout.
The recent price action has been characterized by low momentum, with the pair trading within a narrow range, showing the lack of decision that struck the market. However, the indicators on the chart suggest potential short-term retracement if market conditions persist or a move toward a key resistance level if buying volume increases.
Currently, ADA/USDT is priced at $0.3418, underneath the mid-band, which serves as the dynamic resistance level.
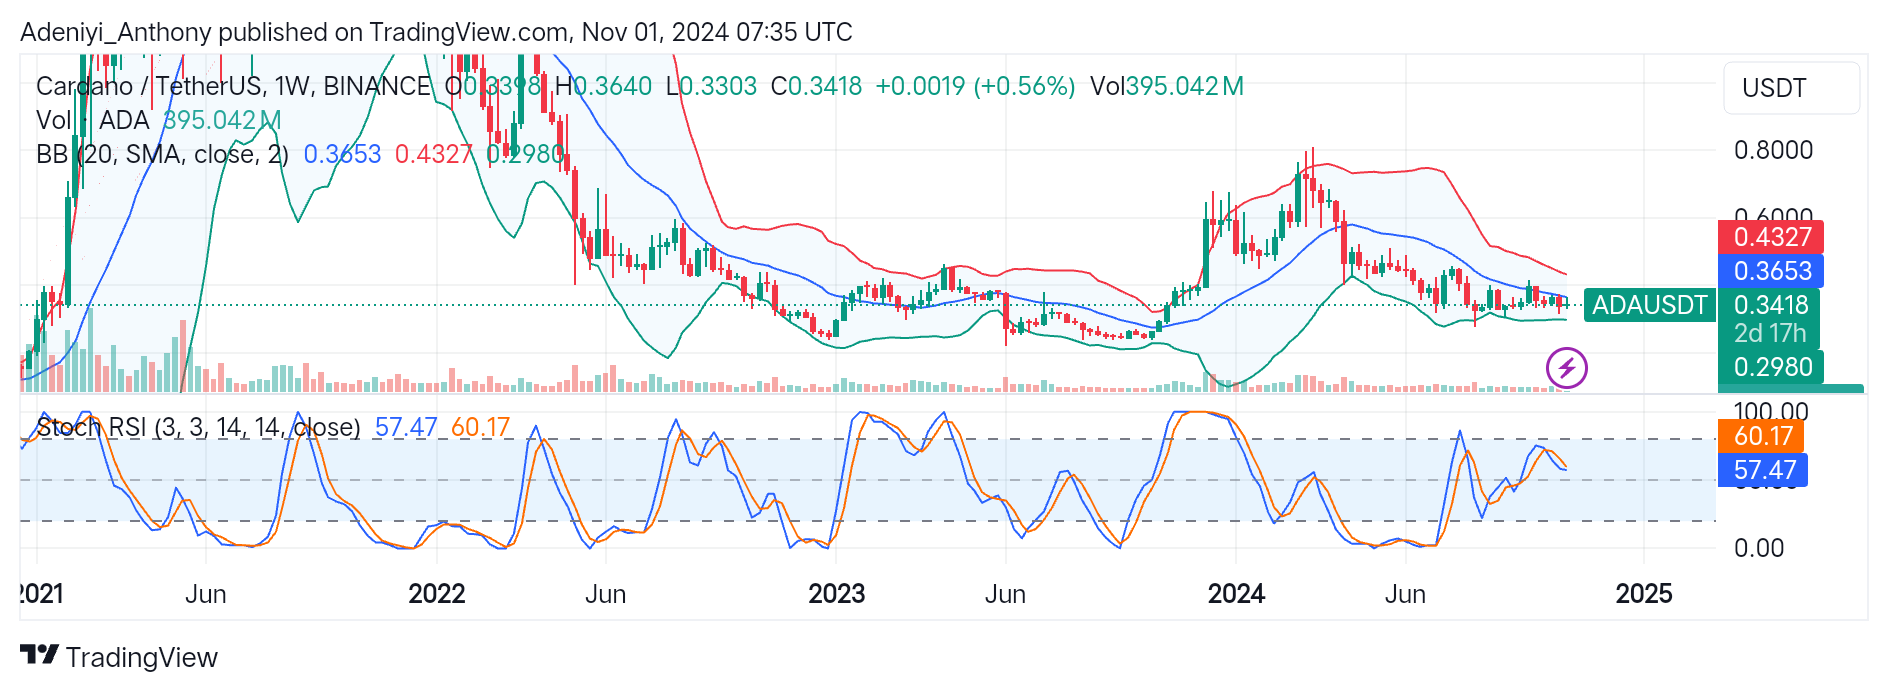
ADA/USDT Technical Indicator
Major Resistance Levels: $0.3653, $0.4327, and $0.5000
Major Support Levels: $0.3300, $0.3100, and $0.2980
Cardano Technical Analysis
In the previous weeks, Cardano has oscillated within a tight range. The squeezed Bollinger bands, which typically precede significant moves, suggest the price might take a clear direction soon. However, ADA/USDT needs to break above or below some critical levels to achieve this feat.
On the downside of the chart, the Stochastic oscillator suggests the pair is operating in the neutral zone slightly under the immediate resistance level, with the lines of the indicators facing the South. However, the pair has seen a 0.56% positive change in trade from the previous session. However, more buying volume is needed for the lines to make an upward reversal.
Moreover, If ADA can break above $0.3653 with sustained volume, it could target $0.4327; conversely, failure to hold at the current price might lead to a retest of lower support levels at $0.3300 and beyond.
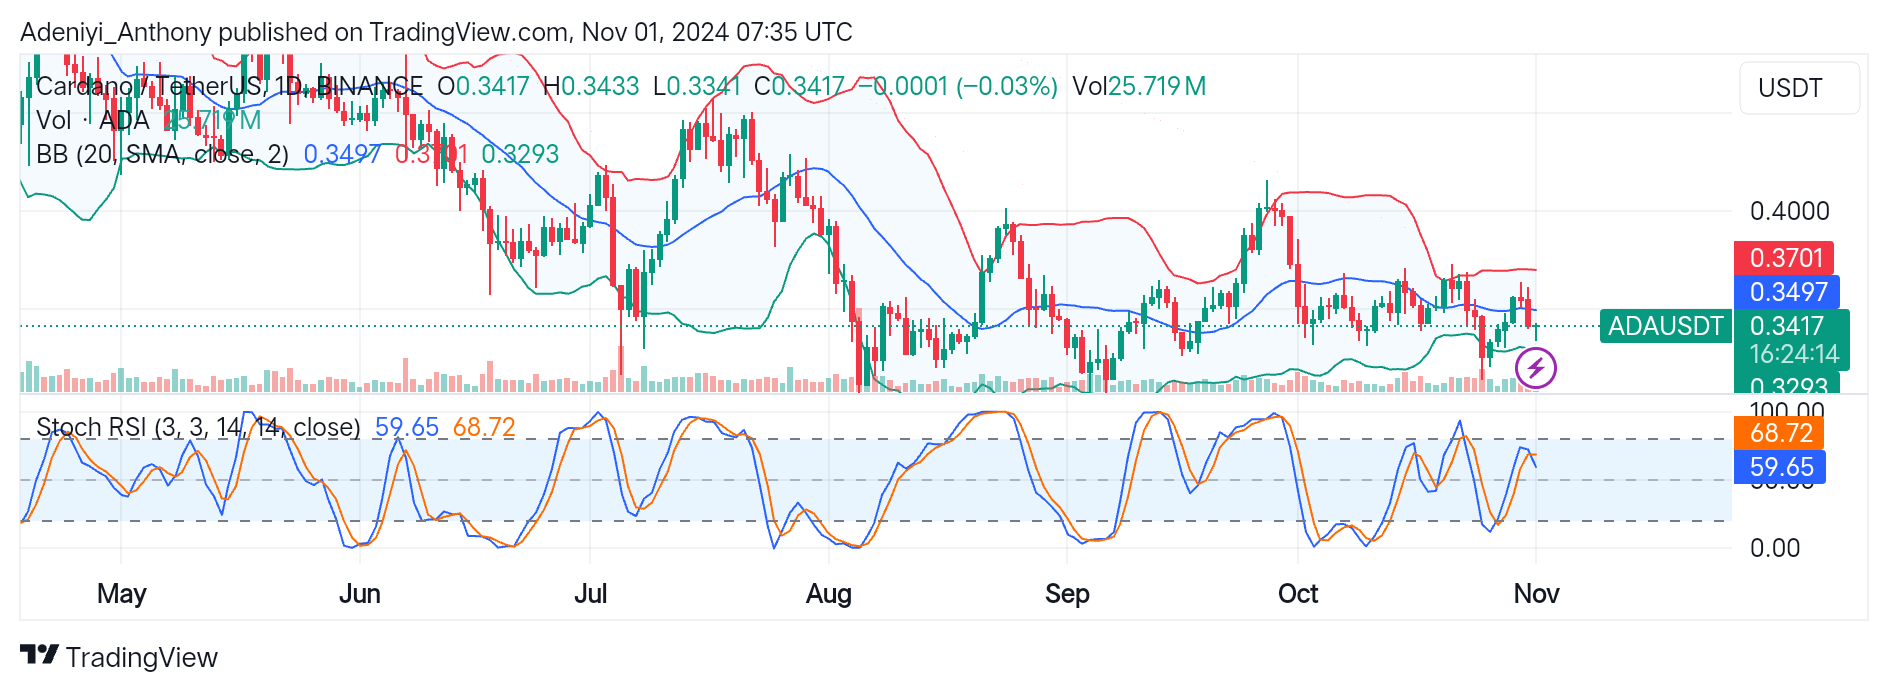
ADA/USDT Analysis: Breakout to Which Direction?
ADA/USDT on the daily timeframe has been oscillating within a tight range with a neutral market sentiment. The price has been fluctuating near the middle Bollinger band, further picturing the lack of traders in the pair.
However, with the current market condition, the squeezed Bollinger bands suggest an impending breakout from either direction. Should ADA break above $0.3497, it may target the next resistance at $0.3701. Conversely, if ADA fails to maintain the current level, it may lead to a retest of a lower support level at $0.3294.
On the other hand, the Stochastic oscillator suggests the pair is close to the overbought region, indicating ADA/USDT might be due for a short-term pullback. Unless the buying pressure increases, the pair might hit the lower support levels.
You can purchase crypto coins here. Buy LBlock