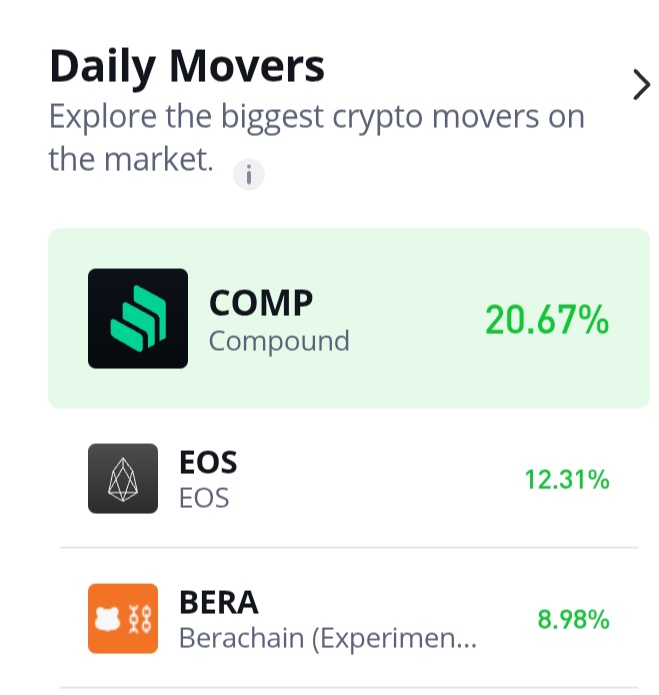
Compound (COMP/USD) Bulls Hold Strong, Aiming to Sustain Recovery
Estimated Reading Time: 3 minutes
Don’t invest unless you’re prepared to lose all the money you invest. This is a high-risk investment and you are unlikely to be protected if something goes wrong. Take 2 minutes to learn more
The Compound (COMP) market has been in a steady downtrend since late last year. At its peak, the price reached $142, but it has gradually declined from this high, eventually dropping to the $40 level. Interestingly, this same $40 level served as the starting point for last year’s bull run, which propelled the price to its $140 peak.
As the bear market continues to push prices toward this critical support zone, a period of consolidation has emerged, indicating that traders are turning cautiously optimistic around this level. Today’s market action suggests a potential bullish recovery, with early signs of buying pressure. Given that today marks the beginning of a new month—April 1st—investors will be watching closely to see if this period ushers in renewed upward momentum for the Compound (COMP) market.
Compound Market Data
- COMP/USD Price Now: $46
- COMP/USD Market Cap: $ 415 million
- COMP/USD Circulating Supply: 8.9 million COMP
- COMP/USD Total Supply: 10 million COMP
- COMP/USD CoinMarketCap Ranking: #118
Key Levels
- Resistance: $45, $50, and $55
- Support: $35, $30, and $25
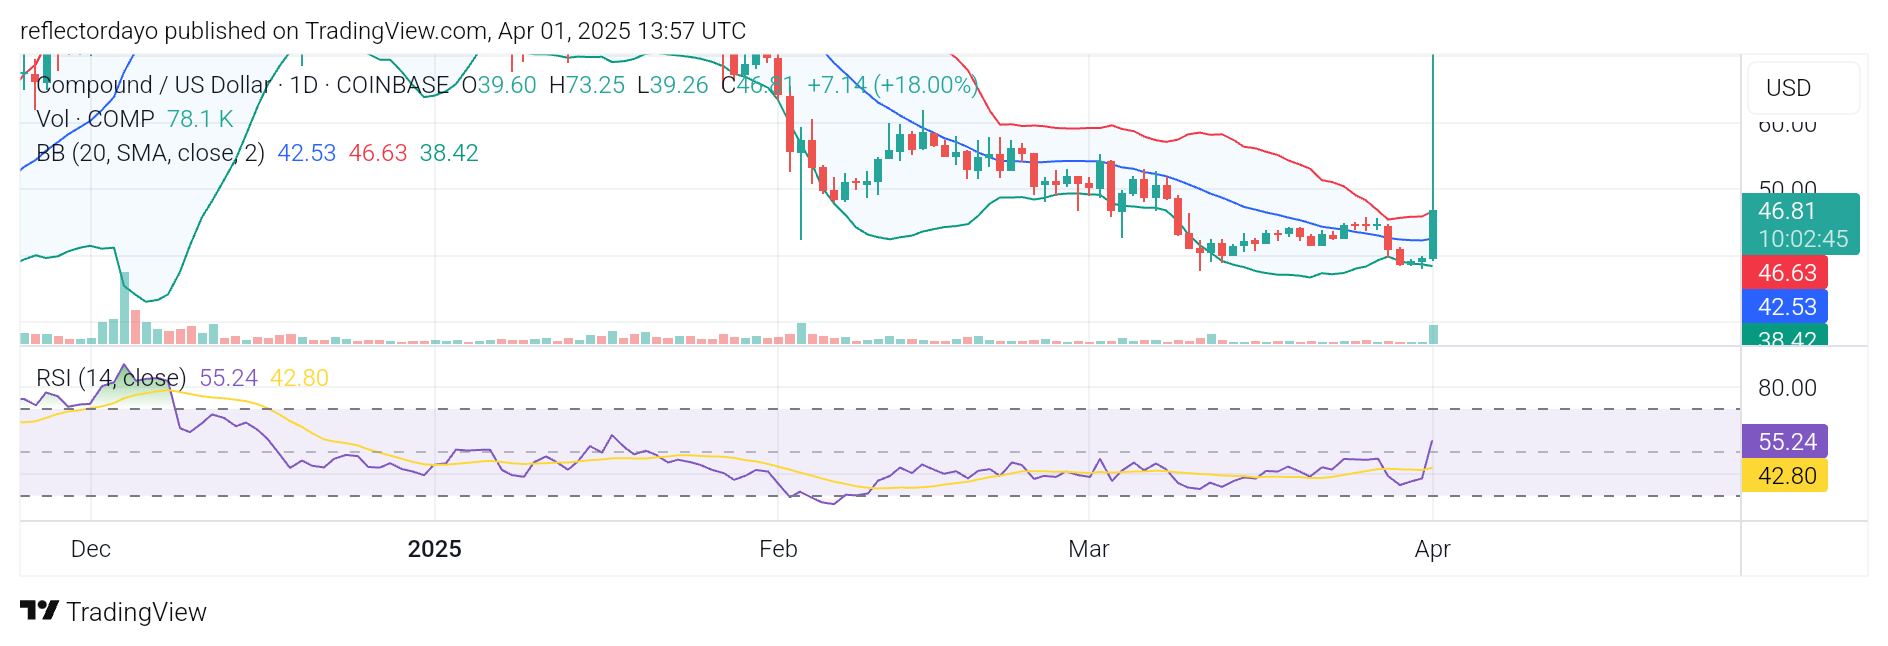
Compound Market Through the Lens of Indicators
In the early part of today’s trading session, Compound (COMP) experienced a remarkable price surge. From the $40 level, the price skyrocketed to a peak of $70, triggering significant profit-taking at that level, which led to a sharp market correction in the crypto signal.Typically, such a strong hyper-bullish move is followed by an equally intense bearish reaction, and that is precisely what has played out in the market so far. As a result, most of the earlier gains have been eroded by bearish activity.
Currently, bulls are attempting to stabilize the price near the key resistance level at $45. However, one potential advantage of this price movement is that bulls may be able to flip this resistance into a new support level, which likely explains why the price is still holding around $46. Additionally, the market continues to see a relatively higher trading volume compared to recent sessions, adding credibility to the ongoing bullish recovery.
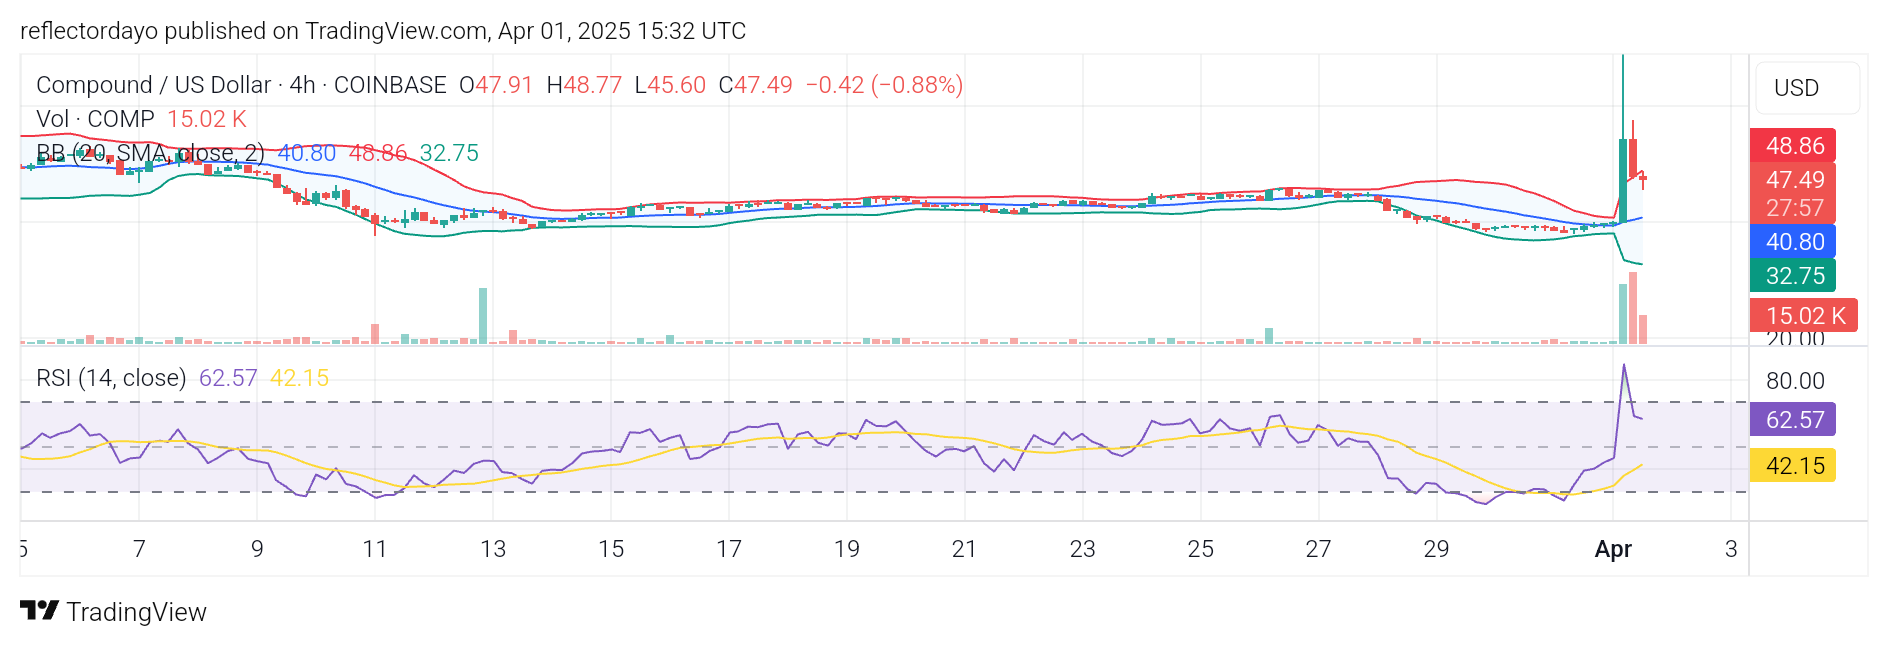
COMP/USD Price Prediction: 4-Hour Chart Analysis
While the Bollinger Bands on the daily chart do not indicate a significant surge in market volatility, the four-hour chart presents a different picture. Here, the bands are expanding in response to the sudden influx of buying interest. Such sharp increases in volatility often lead to erratic price movements between highs and lows.
Despite this volatility, bearish momentum appears to be weakening as the market approaches the $45 level. This suggests that bulls may have successfully reclaimed this level as support. If this holds, more traders could enter the market, recognizing the breakout above a key resistance level. This increased buying pressure could further fuel upward price movement.