Dogecoin (DOGE/USD) Trade Reduces, Testing $0.09 for a Bottom
Estimated Reading Time: 3 minutes
Don’t invest unless you’re prepared to lose all the money you invest. This is a high-risk investment and you are unlikely to be protected if something goes wrong. Take 2 minutes to learn more
Dogecoin Price Prediction – December 18
After a line of price action rejections below the resistance line of $0.011, the DOGE/USD trade presently keeps a correction, testing $0.090 for a bottom.
It appears that forces to add more weights toward getting longer lows have been gradually lessening around the point of $0.090. It is psychologically inclined for buyers to leverage the production of a trade input for the rebounding motions that could surface in no time. A large bullish candlestick has to form from around the $0.080 line or above it. Between those points, if an indecision trade has to play out, the subsequent trading days are bound to witness sideways. But investors are in a better position to experience upsurges.
DOGE/USD Market
Key Levels:
Resistance levels: $0.105, $0.115, $0.125
Support levels: $0.080, $0.075, $0.070
DOGE/USD – Daily Chart
The DOGE/USD daily showcases that the crypto market keeps a correction, testing $0.090 for a bottom around the middle Bollinger Band.
The upper Bollinger band is moving slightly eastward, just under the $0.11 mark, while the stochastic oscillators are positioning themselves northward from the bottom and middle Bollinger bands. The blue half has been pulled into the oversold area by the stochastic oscillators, indicating that there are some declining pressures despite the lack of strong resistance to go lower.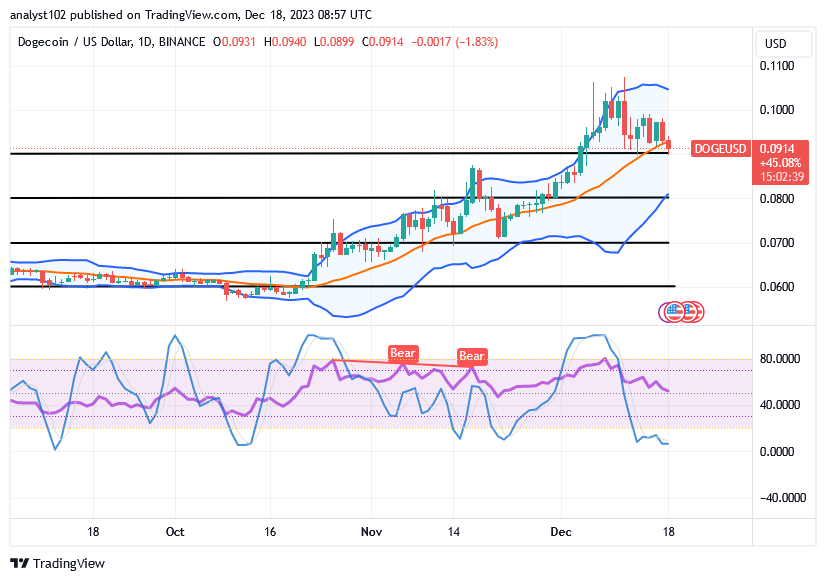
As of right now, with $0.0914 at 1.83 negatives in the DOGE/USD market, what is the best trade strategy?
It is likely that an environment will witness some recessions carrying alongside lighter lower lows between the middle and lower Bollinger Bands as the DOGE/USD trade keeps a correction, testing $0.09 for a bottom-building process.
Should the trading operations be extended slightly southward further, purchasers are likely to acquire rebound inputs over the $0.080 mark. Long-position placers are anticipated to be executing positions before the uprising motion resumes if that assumption proves to be correct in the next operations.
Once buyers fail to maintain tight positions around the middle Bollinger Band trend line, bears will be forced to adopt a consolidation movement pattern. Given the likelihood that the scenario described above will really play out, falling activity will therefore probably revisit a low near the lower Bollinger Band’s value in order to generate the required retracement pressure.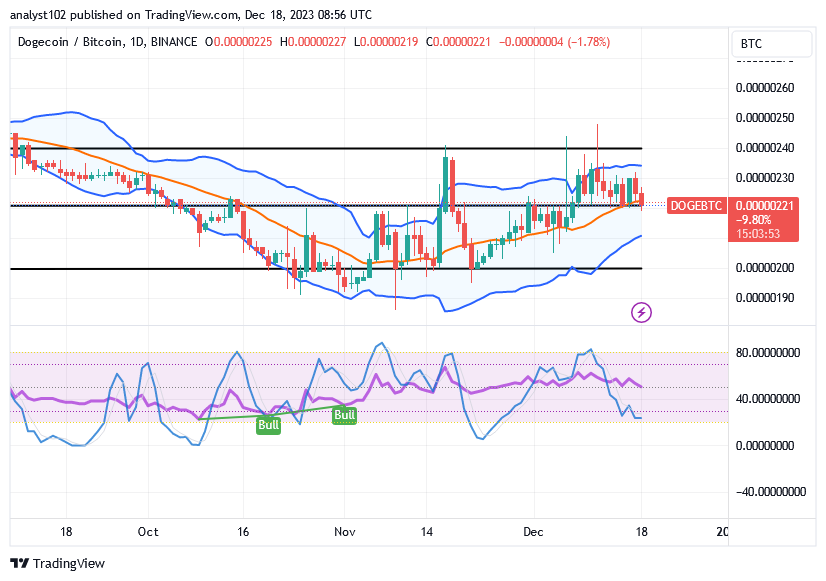
DOGE/BTC Price Analysis
In contrast, the Dogecoin trade keeps a correction versus the valuation of Bitcoin, testing around the middle Bollinger Band for a bottom.
A precautionary index has been established against the direction that the counter cryptocurrency is currently pushing by the positional outlook of the stochastic oscillators in the oversold region at the time of this technical article. The Bollinger Band indicators show that the base cryptocurrency is about to have the strength necessary to support subsequent increases because it is systemically positioned northward inside broad range-bound zones.
Note: Cryptosignals.org is not a financial advisor. Do your research before investing your funds in any financial asset or presented product or event. We are not responsible for your investing results.
You can purchase Lucky Block here. Buy LBLOCK