Ethereum (ETH/USD) Trade Extends Rebounding Motions
Estimated Reading Time: 3 minutes
Don’t invest unless you’re prepared to lose all the money you invest. This is a high-risk investment and you are unlikely to be protected if something goes wrong. Take 2 minutes to learn more

Free Crypto Signals Channel
Ethereum Price Prediction – February 7
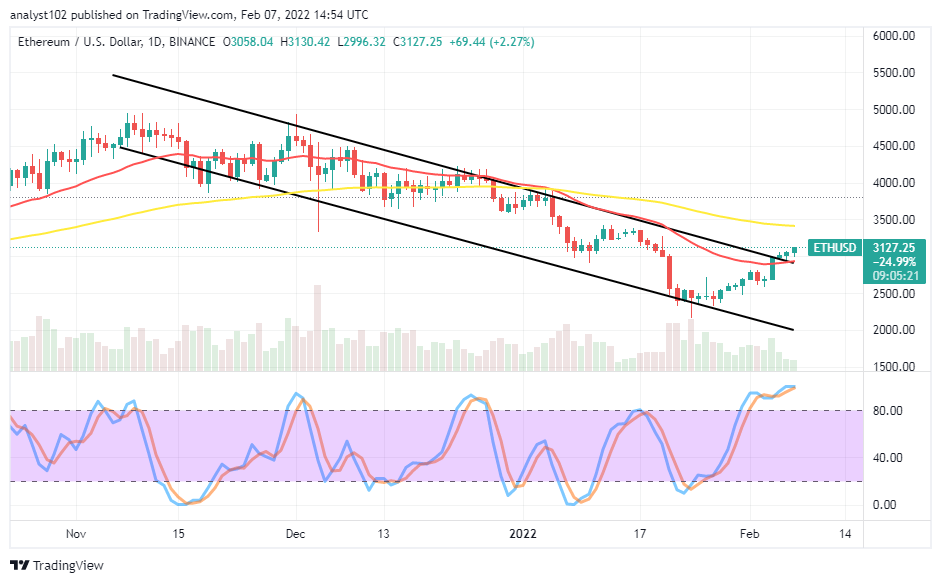
The forthcoming movements on the ETH/USD financial book of records have made the crypto-economic trade extends rebounding motions. Presently, the crypto economy has been pushing between $3,130 and $2,996 high and low-value lines at a percentage of 2.27 positives.
ETH/USD Market
Key Levels:
Resistance levels: $3,250, $3,500, $3,750
Support levels: $2,750, $2,500, $2,250
.
ETH/USD – Daily Chart
The ETH/USD daily chart reveals the crypto-economic trade extends rebounding motions. The smaller SMA trend line breached northwardly during the February 4th trading sessions to lead the subsequent moves upward through some resistances beneath the bigger SMA trend line. The Stochastic Oscillators are in the overbought region, moving in a consolidation northbound to indicate that an upward is still ongoing.
Will the ETH/USD market valuation push northward more as the crypto trade extends rebounding motions?
The indication that suggests a long-holding trading situation for northward forces hasn’t portended a change retarding as the crypto trade extends rebounding motions. The current higher psychological trading spots are within $3,000 and $3,500 levels where price has to push for more ups in its consolidation moving procedures. But, the formerly value-line mentioned has to be the peak point against seeing more sustainable ups.
On the downside of the technical analysis, the ETH/USD market short-position takers have to exercise some more patience before taking repositions against the current upward trend rebounding force. A bearish engulfing candlestick is highly needed at a point in time at a higher trading spot before considering a sell order. A sudden spike aiming to push break past a higher resistance at $3,250 may not survive holding above the higher resistance around the $3,500 level in the long run.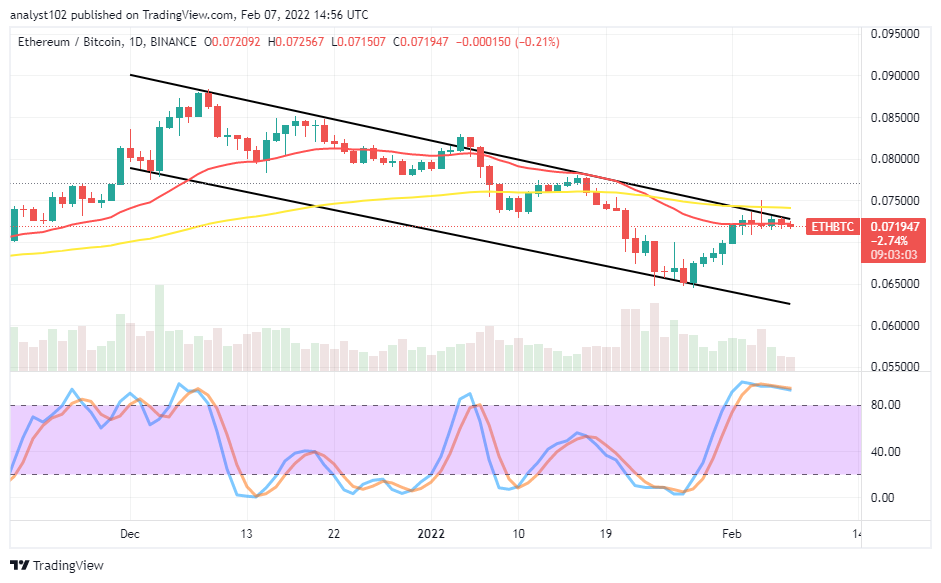
ETH/BTC Price Analysis
In comparison, Ethereum’s trending capacity as placed with Bitcoin now features in an overbought zone, denoting the base instrument tends to fall in the near time. The Cryptocurrency pair trade extends motions consolidating around the smaller SMA trend line. The 50-day SMA indicator is above the 14-day SMA indicator. The Stochastic Oscillators have conjoined their lines in the overbought region to signify the flagship counter crypto will most likely exert forces on the base crypto in the near time.s
Note: Cryptosignals.org is not a financial advisor. Do your research before investing your funds in any financial asset or presented product or event. We are not responsible for your investing results.
You can purchase crypto coins here. Buy Tokens