SPONGE/USD ($SPONGE) At a Crossroads: Can Bulls Leverage Key Support for a Breakout?
Estimated Reading Time: 3 minutes
Don’t invest unless you’re prepared to lose all the money you invest. This is a high-risk investment and you are unlikely to be protected if something goes wrong. Take 2 minutes to learn more

SPONGE/USD ($SPONGE) is demonstrating impressive resilience, consistently maintaining its position above the $0.00011 price point. This prolonged stability hints at robust bullish sentiment, even as the asset trades within what’s been a broader bearish range. The immediate question for traders is: what’s on the horizon for $SPONGE? A deep dive into the technicals might offer some clues.
Key Technical Levels
- Resistance: $0.000115, $0.000120, $0.000130
- Support: $0.000090, $0.000085, $0.000080
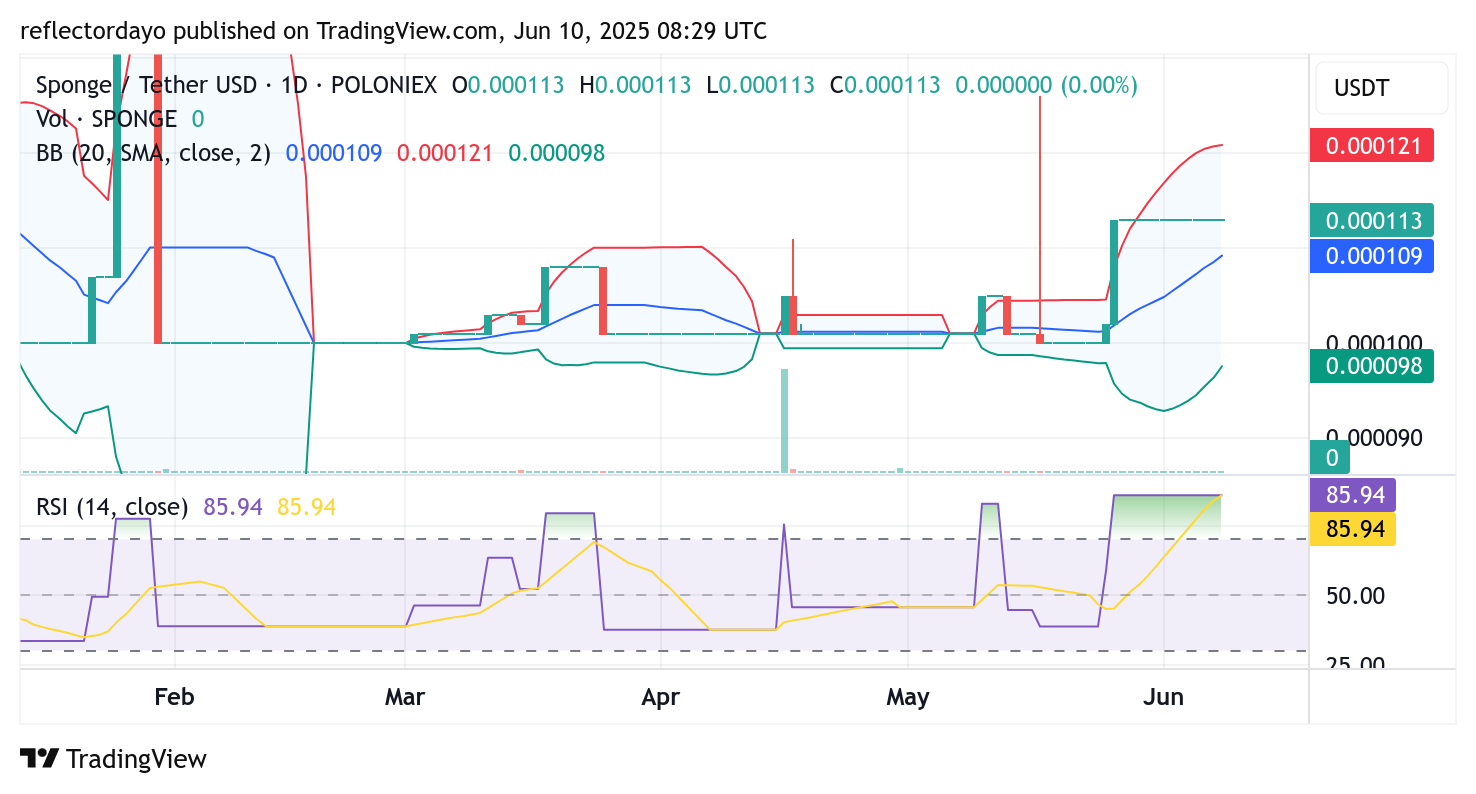
SPONGE/USD Daily Chart: Building a Higher Base for the Next Leg Up
While bulls currently have the upper hand, certain technical indicators point to the possibility of a short-term retracement. However, even a temporary price dip could present re-entry opportunities at elevated levels, potentially forming higher lows. This prevailing momentum could pave the way for $SPONGE to establish a new, strengthened support base. If confirmed, this would create a solid foundation for the next bullish surge and a strategic point for sidelined traders to jump back in.
Though SPONGE/USD has seen some sideways movement lately, the overall market remains dynamic. The daily Bollinger Bands are still wide, reflecting persistent volatility despite the ongoing consolidation. Notably, the lower Bollinger Band is starting to turn upward, gradually aligning with the price action. This subtle shift suggests the crypto signal is stabilizing at more favorable levels, reinforcing the strength of the underlying bullish trend.
The Relative Strength Index (RSI) sits high in overbought territory, indicating a potential near-term cooldown. Yet, any pullback that forms a higher low would only solidify the bullish outlook, acting as a springboard for renewed upward momentum
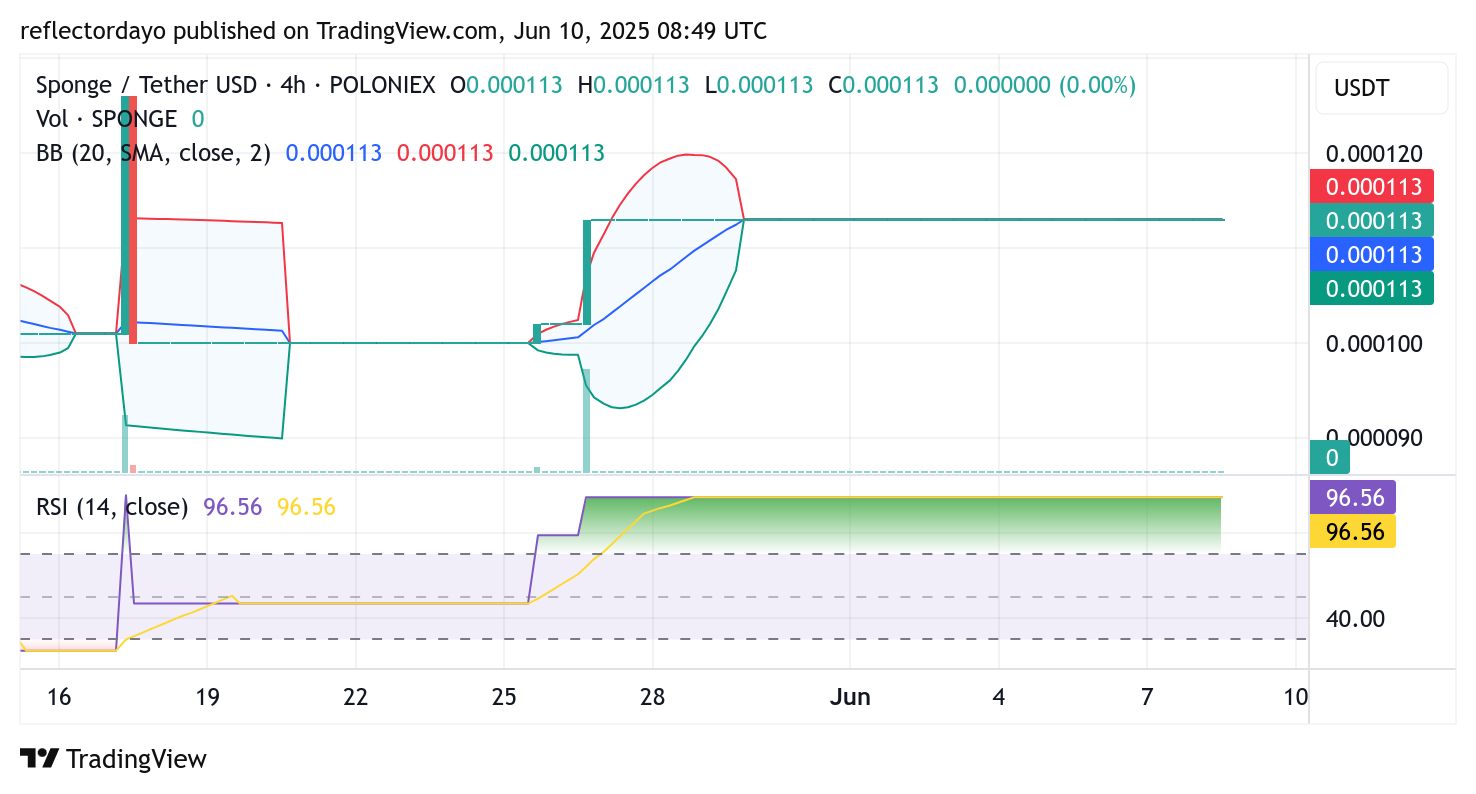
SPONGE/USD 4-Hour Chart: Volatility Squeeze Hints at Imminent Price Action
On the 4-hour chart, SPONGE/USD is exhibiting classic signs of a volatility squeeze, with its Bollinger Bands contracting sharply. This pattern frequently precedes a significant price movement, potentially signaling the start of a fresh breakout.
Adding to this, the RSI on the 4-hour timeframe is hovering around 96. This exceptionally high reading confirms a strong bullish drive but also suggests an overbought condition. A brief correction might be necessary to cool the market, but such a move could empower bulls to regroup and propel prices even higher.
With buying pressure still dominating and technical patterns aligning, the current market structure leans towards a bullish continuation—provided the $0.00011 support level remains intact.
Buy $SPONGE!
Embrace the DAMP 💦💦 pic.twitter.com/tHNwJVQx61
— $SPONGE (@spongeoneth) June 7, 2025
Join the SPONGE community and get in on the next big crypto opportunity! Buy Sponge ($SPONGE) today