SPONGE/USD ($SPONGE) Maintains Strength Above $0.00011 as Market Eyes Next Major Move
Estimated Reading Time: 3 minutes
Don’t invest unless you’re prepared to lose all the money you invest. This is a high-risk investment and you are unlikely to be protected if something goes wrong. Take 2 minutes to learn more

The $SPONGE market continues to demonstrate resilience, maintaining its position above the critical $0.00011 level for an extended period. This prolonged stability highlights the strength of bullish sentiment, even as price action remains within a broader bearish zone.
The key question now is, what comes next for the market? A closer examination of technical indicators may provide valuable insights into the potential direction of the next significant move.
Key Technical Levels
- Resistance: $0.000115, $0.000120, $0.000130
- Support: $0.000090, $0.000085, $0.000080
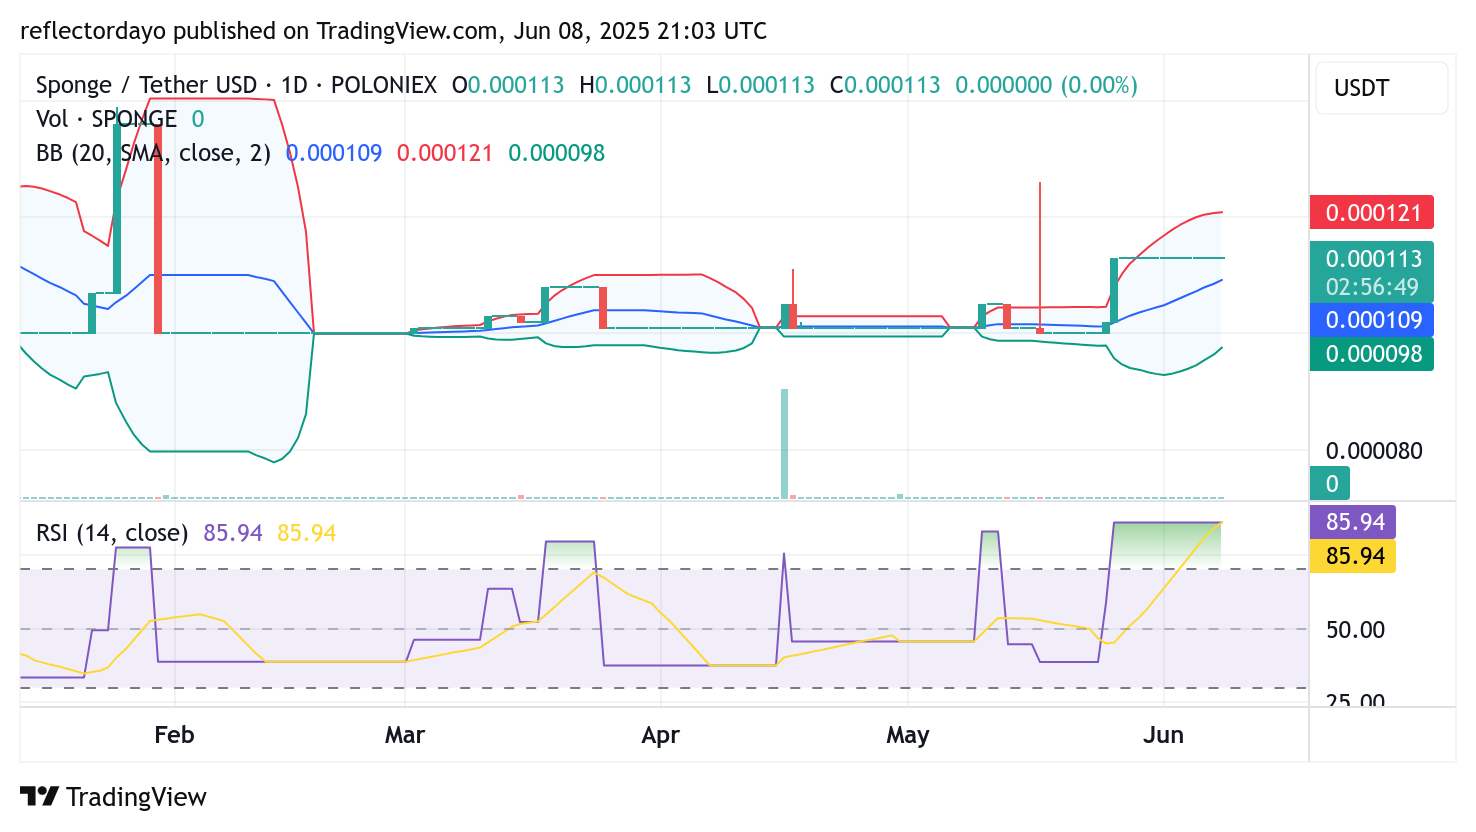
SPONGE/USD Daily Chart: Consolidation Holds as Bullish Trend Gathers Steam
Although the bulls remain in control for now, technical indicators suggest a potential short-term pullback may be on the horizon. However, even in the face of a possible price correction, traders could re-enter at higher price levels, resulting in the formation of higher lows. That said, the current momentum may enable $SPONGE to establish a new, elevated support base. If this development is confirmed, it would provide a strong foundation for the next bullish leg and offer a strategic re-entry opportunity for traders on the sidelines.
While SPONGE/USD has been trading sideways in recent sessions, the broader market remains notably active. The daily Bollinger Bands remain wide, reflecting persistent volatility despite the current consolidation.
Notably, the lower Bollinger Band is beginning to curve upward, gradually aligning with the ongoing price action. This subtle upward shift in the crypto signal suggests that the market is stabilizing at higher levels, reinforcing the strength of the prevailing bullish trend.
The Relative Strength Index (RSI) remains elevated and has entered overbought territory, pointing to a potential near-term retracement. However, any pullback that results in the formation of a higher low would further strengthen the bullish outlook and could serve as a springboard for renewed upward momentum.
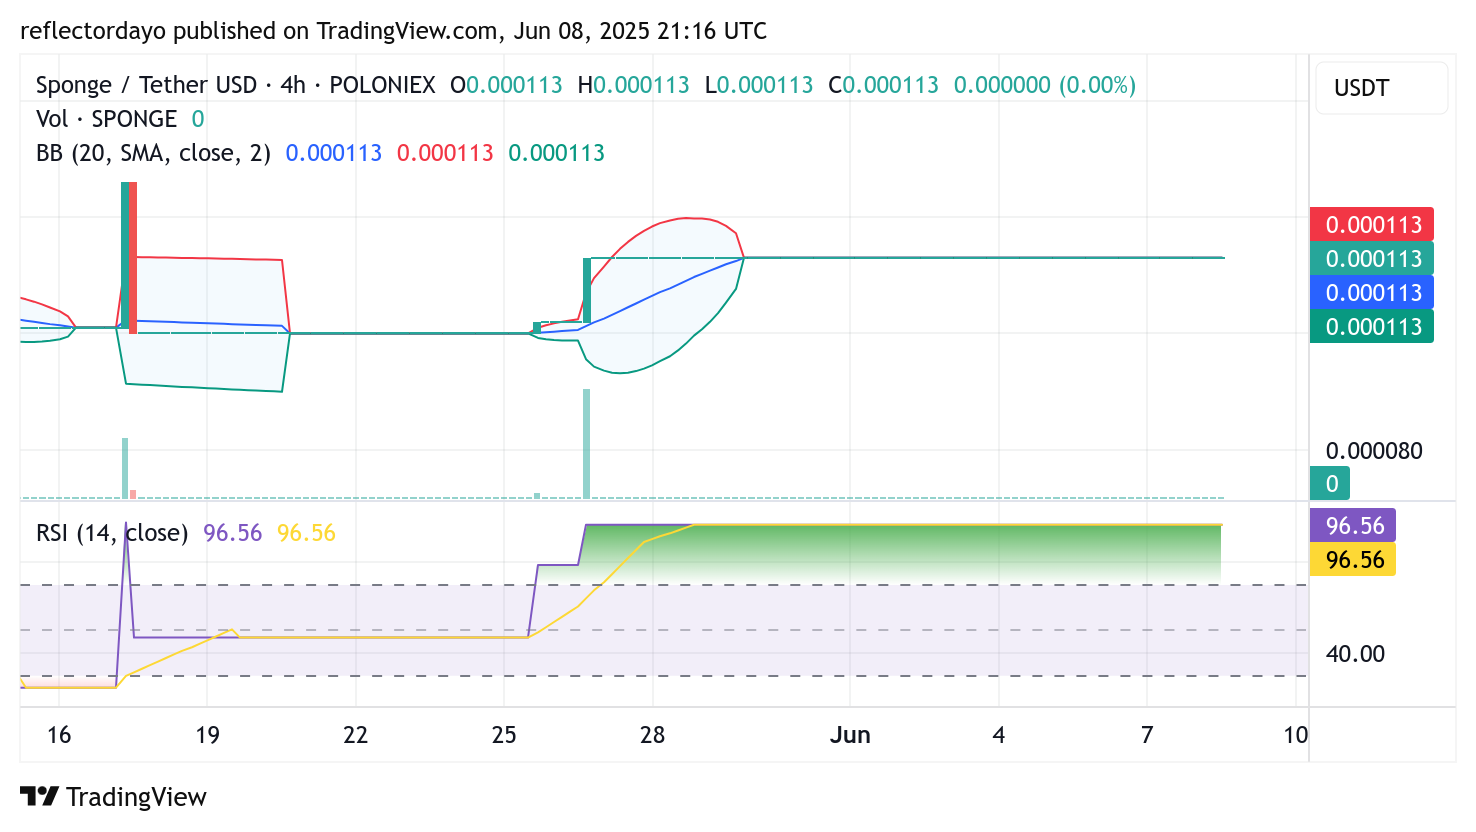
SPONGE/USD 4-Hour Chart: Tightening Bollinger Bands Hint at Imminent Breakout
Zooming into the 4-hour chart, SPONGE/USD is showing signs of a classic volatility squeeze, with Bollinger Bands tightening significantly. This pattern often signals that a large price move is approaching, potentially marking the start of a fresh breakout.
Adding to this, the RSI on the 4-hour timeframe is hovering near 96—an exceptionally high reading that confirms strong bullish momentum, though also warning of an overbought condition. A short-term correction may be needed to cool off the market, but such a move could give bulls an opportunity to regroup and drive prices even higher.
With buying pressure still dominant and technical patterns lining up, the current structure favors a bullish continuation—provided the $0.00011 support remains intact.
Buy SPONGE/USD!
Embrace the DAMP 💦💦 pic.twitter.com/tHNwJVQx61
— $SPONGE (@spongeoneth) June 7, 2025
Join the SPONGE community and get in on the next big crypto opportunity! Buy Sponge ($SPONGE) today