SPONGE/USD ($SPONGE) Holds Ground Above $0.00011 as Traders Brace for Major Move
Estimated Reading Time: 3 minutes
Don’t invest unless you’re prepared to lose all the money you invest. This is a high-risk investment and you are unlikely to be protected if something goes wrong. Take 2 minutes to learn more

SPONGE/USD remains firmly anchored above the crucial $0.00011 mark after a recent upward breakout, signaling ongoing bullish dominance. Price action has since entered a consolidation phase, hovering tightly above this significant support area. The continued stability at this level reflects positive sentiment and a market hesitant to give ground.
Although the bulls have maintained control, some technical signals now suggest a potential short-term pullback. That said, the momentum behind the latest rally raises the possibility of a new, higher support base forming. Such a development would provide a more solid platform for a renewed bullish push, offering traders another opportunity to enter the market on favorable terms.
Key Price Levels to Watch
-
Resistance: $0.000115, $0.000120, $0.000130
-
Support: $0.000090, $0.000085, $0.000080
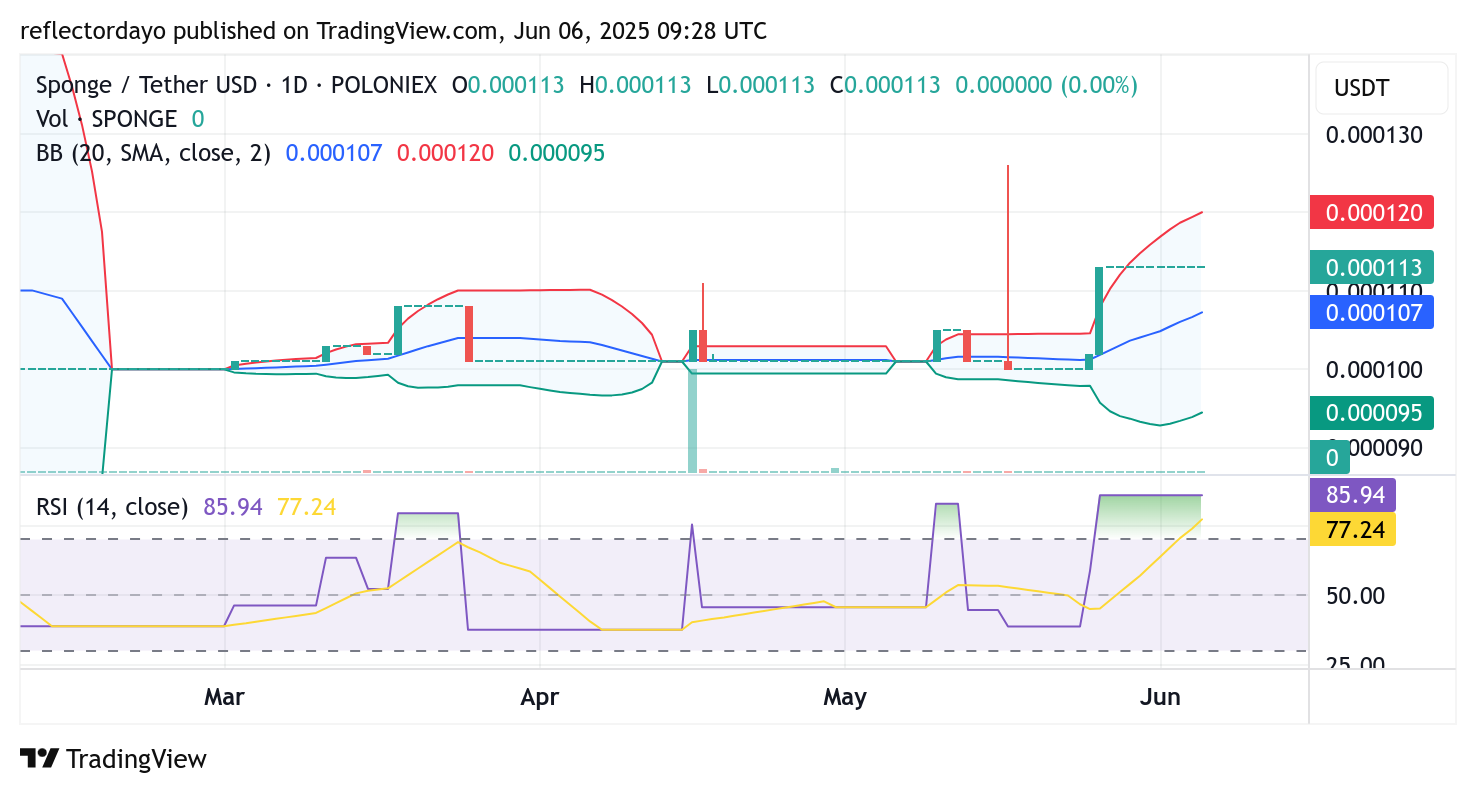
SPONGE/USD Daily Chart: Bullish Bias Maintains Grip Amid Active Market
Despite a period of sideways price behavior, SPONGE/USD continues to display elevated market activity. Volatility, though less erratic than before, remains evident, as seen in the still-wide Bollinger Bands on the daily timeframe.
Interestingly, the lower Bollinger Band is beginning to curve upward, subtly converging with the current consolidation area. This technical development points to a stabilization in downside risk and suggests that bullish momentum is holding firm.
However, the Relative Strength Index (RSI) remains in overbought territory, indicating that a brief dip could be on the horizon. Still, if buyers step in to defend a new higher support during the retracement, it could confirm bullish strength and open the door for a fresh upward breakout.
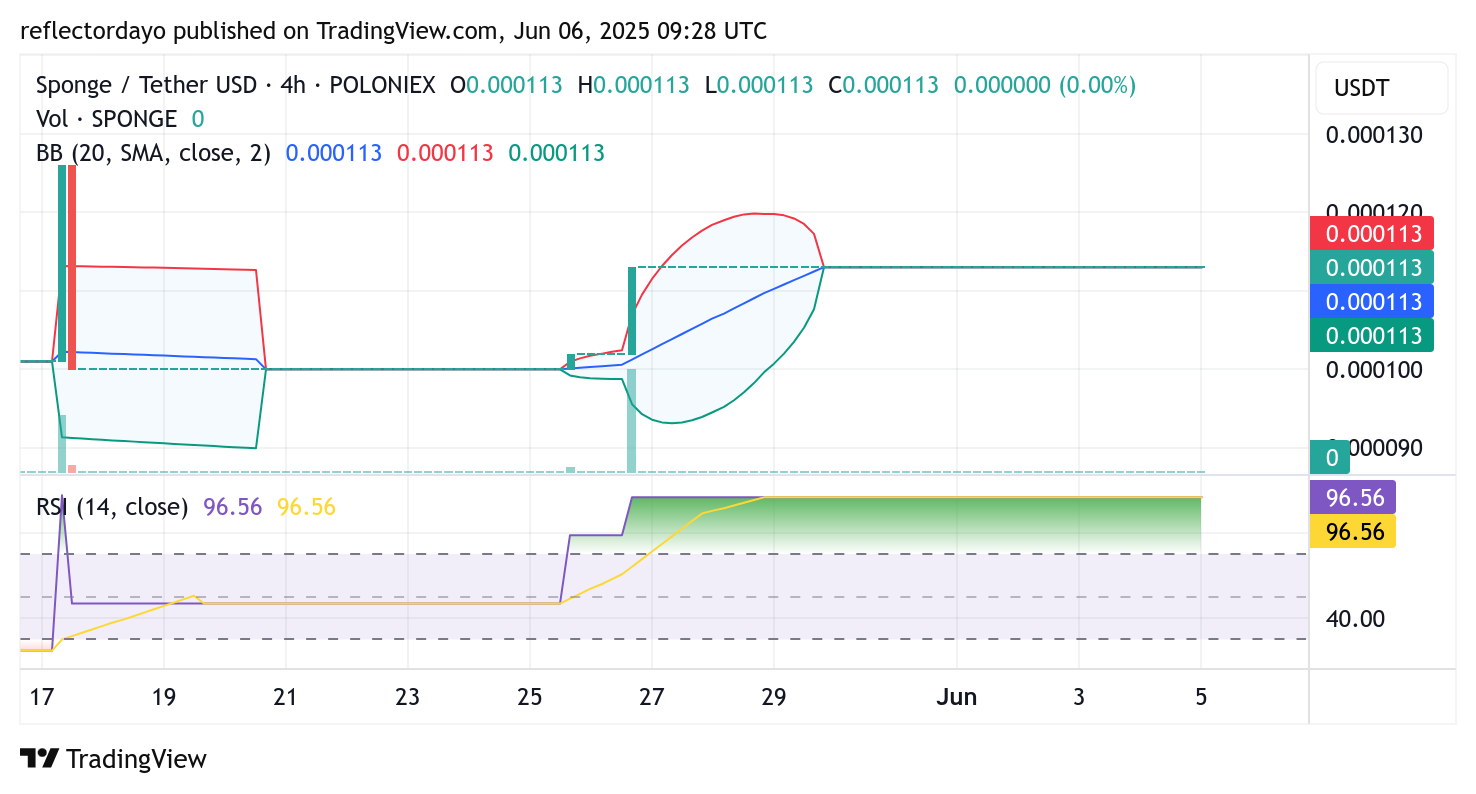
SPONGE/USD 4-Hour Chart: Tightening Bollinger Bands Foreshadow Big Move
On the 4-hour chart, a different dynamic is unfolding. Bollinger Bands are compressing—a classic sign of decreasing short-term volatility and a precursor to a potential breakout. This “volatility squeeze” is often followed by a decisive price move in either direction.
Supporting the bullish case, the RSI on this timeframe is extremely elevated around 96, underlining the intensity of current buying pressure. While this also indicates the market is overextended and a cooldown could be imminent, it confirms that bulls remain firmly in control.
Should the price pull back slightly, a defense of the next higher support zone would reinforce structural strength and possibly trigger the next surge upward. As long as key support levels are respected, the bullish outlook remains intact.
Buy $SPONGE!
The markets will never let you go 🧽💦 pic.twitter.com/SPFvl5X8Od
— $SPONGE (@spongeoneth) June 4, 2025
Join the SPONGE community and get in on the next big crypto opportunity! Buy Sponge ($SPONGE) today