Uniswap (UNI/USD) Features Some Erratic Higher Lows at a $45 Resistance Level
Estimated Reading Time: 3 minutes
Don’t invest unless you’re prepared to lose all the money you invest. This is a high-risk investment and you are unlikely to be protected if something goes wrong. Take 2 minutes to learn more
Uniswap Price Prediction – May 6
On April 28th day’s session, the market valuation of Uniswap broke out at an upper bullish channel trend-line to now feature a line of erratic higher lows a bit above the zone. As of writing, the crypto market is down by 0.67%.
UNI/USD Market
Key Levels:
Resistance levels: $50, $55, $60
Support levels: $35, $30, $25
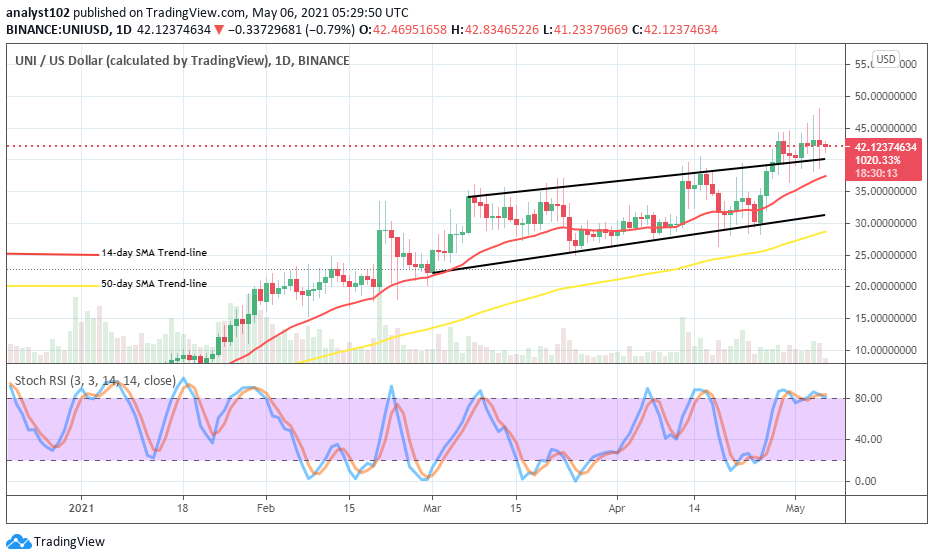
UNI/USD – Daily Chart
On the UNI/USD daily trading chart, the bullish channel trendlines drew appears to still relevant in the determination of this market trend. As it is now, there has been a formation of higher-low candlesticks a bit over the upper bullish channel trend-line. The 14-day SMA trend-line has a bit curved to the north signaling the possibility of the crypto market recording more upsides in the next price moves. The 50-day SMA indicator is located underneath the smaller SMA trading indicator nearing the support point of $30 from below. The Stochastic Oscillators are around range 80 close into the overbought region to consolidate. That shows that the buying situation of the crypto market is holding grand against giving an easy entry to abrupt sell-offs.
What could be the next UNI/USD market direction?
The UNI/USD market’s direction appears getting set to enter a range-bound trading condition in the next session. Bulls need to maintain their support between the levels of $35 and $40 to stage variant upswings against slight downs that the market now tends to witness for a while more. The market level in between $45 and $50 may be tougher for a sustainable upward push afterward.
Analyzing the downside of this crypto market from the points of $45 and $50, bears will have to capitalize on those areas by increasing much effort. However, if the higher value earlier mentioned is eventually breached to the north, it will be a more risky trading moment for short-positions in the market. Therefore, traders ought to abide by trading principles always.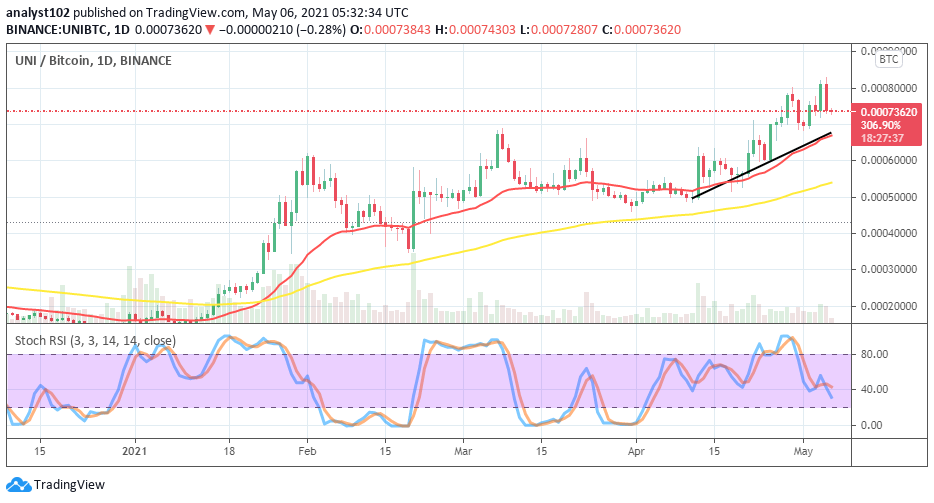
UNI/BTC Price Analysis
In comparison, the price worth of UNI and paired with BTC still possess a degree of prevalence over the valuation of BTC as depicted on the daily trading chart. About a few days back, the counter crypto tried to muscle up against the base crypto’s uptrend. But, with a very less effective outcome as the market line trades on the buy signal side of the SMAs. The 14-day SMA trend-line is above the 50-day SMA indicator. The Stochastic oscillators are at a range of 40 slightly pointing downward to indicate an ongoing push against the high value of the base crypto.
Note: cryptosignals.org is not a financial advisor. Do your research before investing your funds in any financial asset or presented product or event. We are not responsible for your investing results.