Ripple (XRP) Is in a Brief Uptrend, Faces Rejection at Level $1.60
Estimated Reading Time: 2 minutes
Don’t invest unless you’re prepared to lose all the money you invest. This is a high-risk investment and you are unlikely to be protected if something goes wrong. Take 2 minutes to learn more
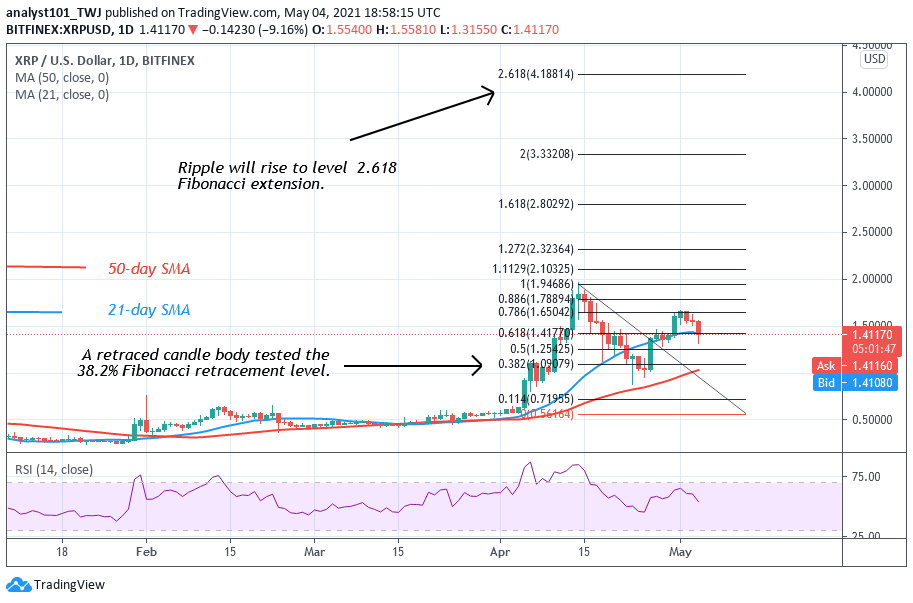
Ripple (XRP) Long-Term Analysis: Bullish
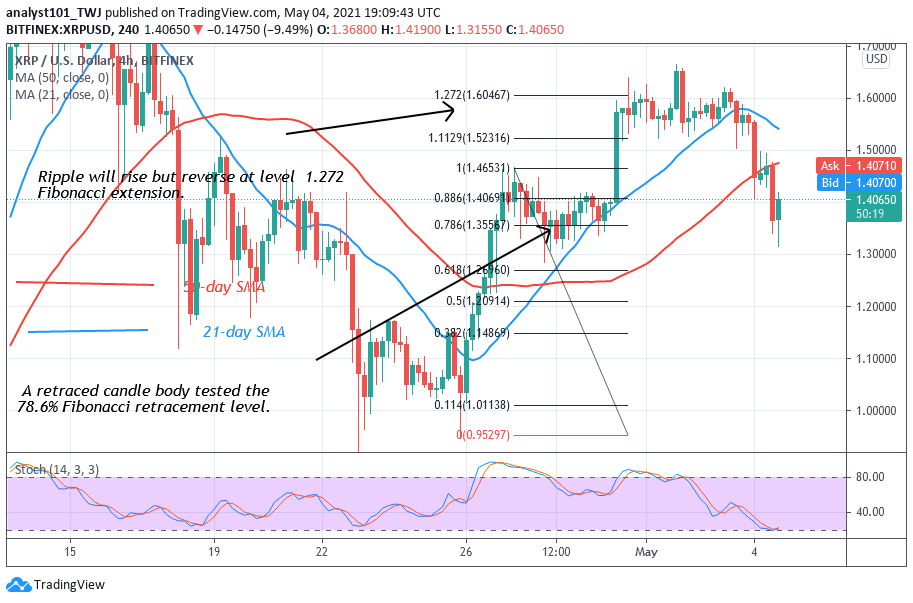
Since April 26, XRP has been in an upward move after the last bearish impulse to the low of $0.95. The uptrend was short-lived as it was repelled at a level of $1.60. Ripple has made some retracement to the support of 21-day SMA. Meanwhile, a retraced candle body tested the 38.2% Fibonacci retracement level. This retracement indicates that Ripple will rise to level 2.618 Fibonacci extension.
Ripple (XRP) Indicator Analysis
Ripple is falling but XRP fell to the support of the 21-day SMA. The uptrend will resume if the 21-day Support holds. XRP has fallen to level 59 of the Relative Strength Index period 14. It indicates that XRP has room to rally on the upside. The moving averages are sloping upward indicating the uptrend.
Technical indicators:
Major Resistance Levels – $2.00, $2.50, $3.00
Major Support Levels – $1.50, $1.00, $0.50
What Is the Next Direction for Ripple (XRP)?
Ripple is likely to move up after a minor retracement. On the 4–hour chart, the altcoin has a brief uptrend. On April 27 uptrend; a retraced candle body tested the 78.6% Fibonacci retracement level. The retracement indicates that the market will reverse at level 1.272 Fibonacci extension. From the price action, the brief uptrend has retraced from the 1.272 Fibonacci level and it is falling.
Note: cryptosignals.org is not a financial advisor. Do your research before investing your funds in any financial asset or presented product or event. We are not responsible for your investing results