$SPONGE (SPONGE/USD) Is Nearing November 17’s $0.0004 Price Level, as the Market Aims to Attain This Milestone
Estimated Reading Time: 2 minutes
Don’t invest unless you’re prepared to lose all the money you invest. This is a high-risk investment and you are unlikely to be protected if something goes wrong. Take 2 minutes to learn more
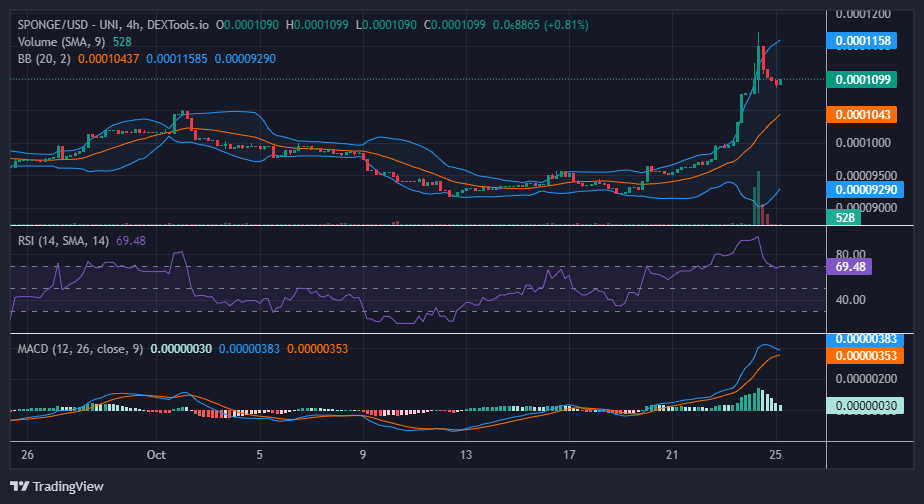
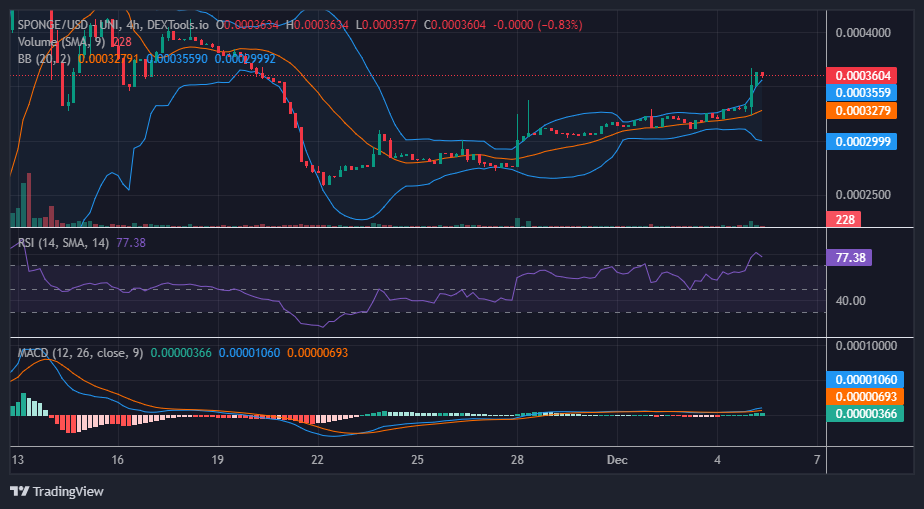
The $SPONGE bull market is making substantial strides towards the $0.0004 price threshold. In today’s initial trading session, prevalent bullish activities propelled the market beyond the $0.00035 price level, charting a course towards the $0.0004 mark. Nonetheless, as the market aggressively advances toward its target, there is an observable emergence of bears. This could be attributed to the possibility that the robust bullish momentum has led to an overbought condition in the market.
Key Price Levels
- Resistance: $0.00040, $0.00045, and $0.00050.
- Support: $0.00020, $0.00019, and $0.00018.
$SPONGE (SPONGE/USD) Price Analysis: Technical Insights
The indicators presently depict an overbought $SPONGE market, signifying strengthening bullish momentum. While the overbought signals from both the Bollinger Bands indicator and the Relative Strength Index could influence traders’ decisions, the bull market’s objective to rally to the $0.0004 price level remains unchanged. Stepping in above the $0.00035 price level may potentially secure the continuation of the bullish trend.
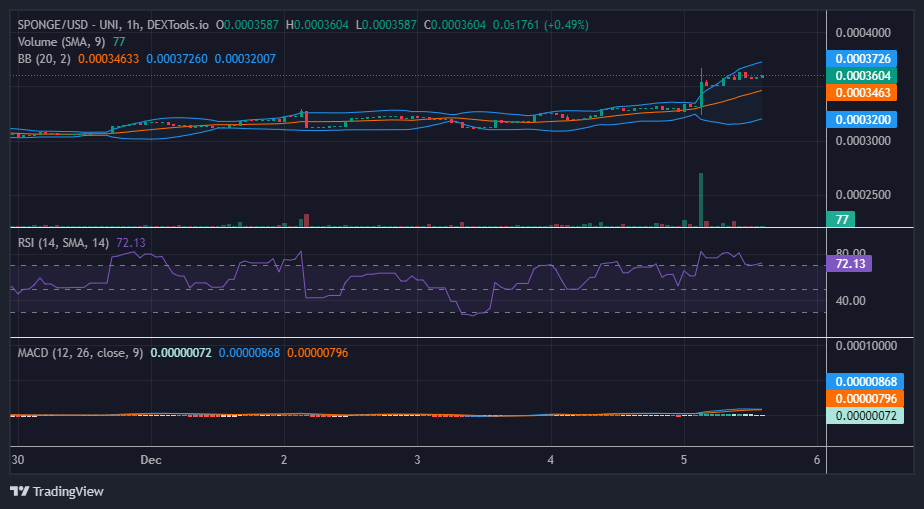
Short-Term Outlok: 1-Hour Chart
As anticipated, there is evident bullish intervention occurring near the $0.00036 price level, with bulls actively entering the market to mitigate bearish sentiment in this area. This has resulted in price consolidation around this level as bullish $SPONGE traders endeavor to maintain the market’s upward trajectory. The Bollinger Bands indicator indicates a correction within the bands. If the bulls successfully establish a support level at this point, it will contribute to the continued upward movement of the market, ultimately reaching the $0.0004 mark.
Buy SPONGE/USD!
When someone disses $SPONGE 💪🧽#Web3 #Crypto #MemeCoin #Alts pic.twitter.com/1DSsoMyKfN
— $SPONGE (@spongeoneth) December 4, 2023
Invest in the hottest and best meme coin. Buy Sponge ($SPONGE) today!