$SPONGE (SPONGE/USD) Surpasses $0.00040, Setting a Pivotal Price Point at $0.00045
Estimated Reading Time: 3 minutes
Don’t invest unless you’re prepared to lose all the money you invest. This is a high-risk investment and you are unlikely to be protected if something goes wrong. Take 2 minutes to learn more

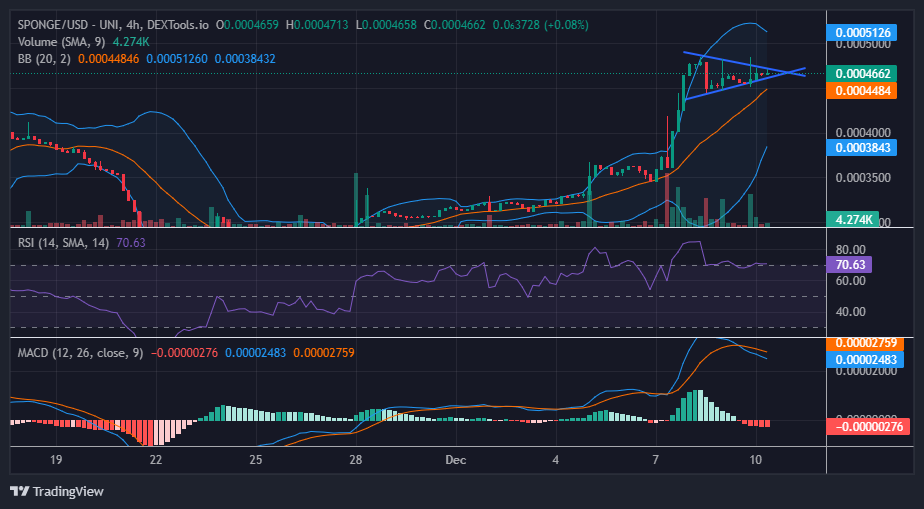
Between December 7th and December 8th, the $SPONGE market exhibited a notable bullish trend. The surge in trader activity within the bull market facilitated a decisive breach of the $0.0004 price threshold, with the price ascending to the $0.00045 level. Presently, the market is experiencing a tug-of-war between bullish and bearish forces, leading to a consolidation phase around the current price level.
Key Price Levels
- Resistance: $0.00047, $0.00048, and $0.00050.
- Support: $0.00020, $0.00019, and $0.00018.
Sponge (SPONGE/USD) Price Analysis: Technical Insights
The Bollinger Bands illustrate market dynamics through the analysis of price action movements. However, given the current consolidation phase in the $SPONGE market above the $0.00045 price level, there is a noticeable convergence occurring in the upper standard deviation curve. The ongoing interplay between supply and demand is contributing to a decline in volatility. This could potentially lead to the establishment of a new critical price level, possibly around the $0.00046 mark.
The Relative Strength Index (RSI) indicates robust bullish sentiment within the market. The momentum reading remains consistently near the overbought threshold on the indicator. Candle formations above the $0.00040 price level are shaping a symmetrical triangle pattern, presenting three potential outcomes: an upside breakout, a downside breakout, or the continuation of the current consolidation. Each outcome bears significance in the context of future price movements.
Short-Term Outlook: 1-Hour Chart
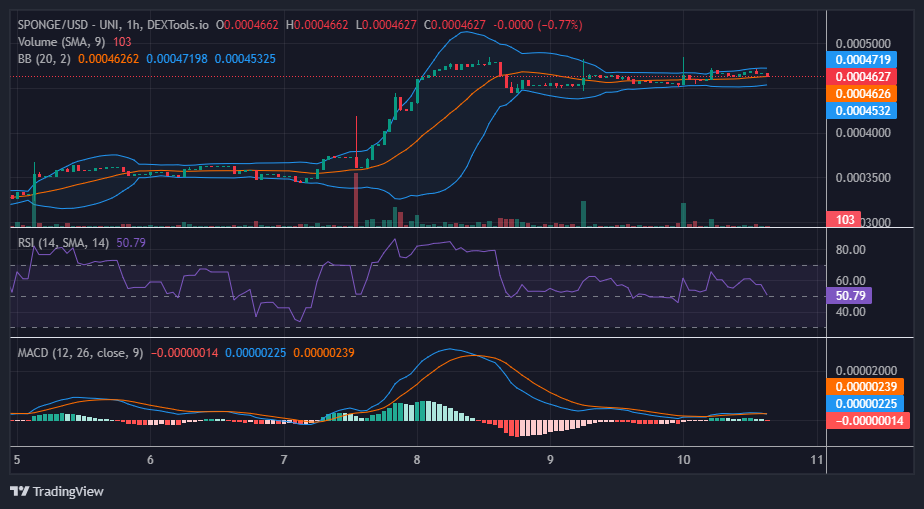
In a one-hour chart analysis of the $SPONGE market, there is a discernible decrease in volatility. The Relative Strength Index (RSI) readings have dipped to approximately 57, indicating a period of sideways movement in the market. The Bollinger Bands depict the price navigating within a confined price channel, suggesting a compression of volatility. Typically, following such market dynamics, a decisive directional movement is anticipated.
See if you’ve made a big impression as one of the recipients by checking your wallets!
🚨 Exciting news, #SPONGERS! 🧽
The $SPONGE Airdrop distribution is now complete! https://t.co/iMAdfg9SiS
Check your wallets to see if you’ve made a splash as one of the recipients! 🌊💰#SPONGE #MemeCoin #Airdrop pic.twitter.com/yw7RKVtcg9
— $SPONGE (@spongeoneth) November 7, 2023
Invest in the hottest and best meme coin. Buy Sponge ($SPONGE) today!