Crypto Candlestick Patterns: What Beginners Should Know
Estimated Reading Time: 3 minutes
Don’t invest unless you’re prepared to lose all the money you invest. This is a high-risk investment and you are unlikely to be protected if something goes wrong. Take 2 minutes to learn more

Candlestick charts are everywhere in crypto. Each candle tells a small story about buyers, sellers and momentum during a specific period.
Learning basic candlestick patterns can help you understand price action more clearly. But it is important not to treat every candle as a guaranteed signal.
What a Candle Shows
A candlestick shows the open, high, low and close for a period of time. The body shows the difference between open and close. The wicks show how far price moved before closing.
A strong bullish candle closes near its high. A strong bearish candle closes near its low. Long wicks can show rejection or volatility.
Bullish Rejection Candles
A candle with a long lower wick can show that sellers pushed price down, but buyers stepped in and drove it back up.
This can be meaningful near support. If a coin wicks below support and closes back above it, traders may see that as a failed breakdown.

Free Crypto Signals Channel
![]() Free Telegram Channel
Free Telegram Channel
Bearish Rejection Candles
A candle with a long upper wick can show that buyers pushed price higher, but sellers rejected the move.
This can matter near resistance. If price spikes above resistance and closes back below it, the breakout may have failed.
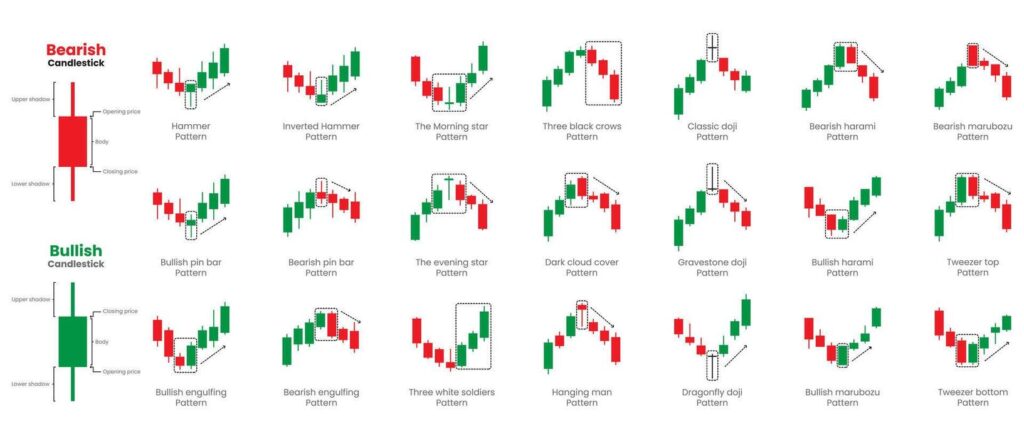
Engulfing Candles
A bullish engulfing candle forms when a strong green candle covers the body of the previous red candle. It can suggest buyers are taking control.
A bearish engulfing candle does the opposite. It can show sellers overpowering buyers.
Again, location matters. An engulfing candle at a key level is more useful than one in the middle of a messy range.
Doji Candles
A doji forms when price opens and closes near the same level. It can show indecision.
Doji candles are not automatically reversal signals. They simply show that neither side clearly won that candle.
 Most Popular
- 2-5 Signals Daily
- 82% Success Rate
- Entry, Take Profit & Stop Loss
- Amount To Risk Per Trade
- Risk Reward Ratio
The Bottom Line
Crypto candlestick patterns help traders read buyer and seller behaviour.
Focus on the basics: strong closes, rejection wicks, engulfing candles and indecision. But always combine candles with trend, levels, volume and risk management. A candle is context, not certainty.
Need help applying this to live market conditions? Get instant access to our VIP trading signals here.