Fibonacci Retracements in Crypto: Useful Tool or Self-Fulfilling Level?
Estimated Reading Time: 2 minutes
Don’t invest unless you’re prepared to lose all the money you invest. This is a high-risk investment and you are unlikely to be protected if something goes wrong. Take 2 minutes to learn more

Fibonacci retracements are popular in crypto trading because they help traders measure pullbacks within a trend. The most watched levels are usually 38.2%, 50%, and 61.8% of a prior move.
The idea is simple. If Bitcoin rallies from $60,000 to $70,000, traders measure that move and watch where price pulls back. A shallow retracement near 38.2% may show strong demand. A deeper retracement near 61.8% may still be healthy if the larger trend remains intact.
 Most Popular
- 2-5 Signals Daily
- 82% Success Rate
- Entry, Take Profit & Stop Loss
- Amount To Risk Per Trade
- Risk Reward Ratio


Fibonacci levels are not magic. Markets do not reverse because of a number alone. They work partly because many traders watch the same zones. If enough participants expect a reaction around a level, orders can cluster there.
The best Fibonacci levels are those that overlap with other evidence. A 61.8% retracement sitting near previous resistance, a high-volume node, and a rising moving average is more meaningful than a random Fib level in empty space.
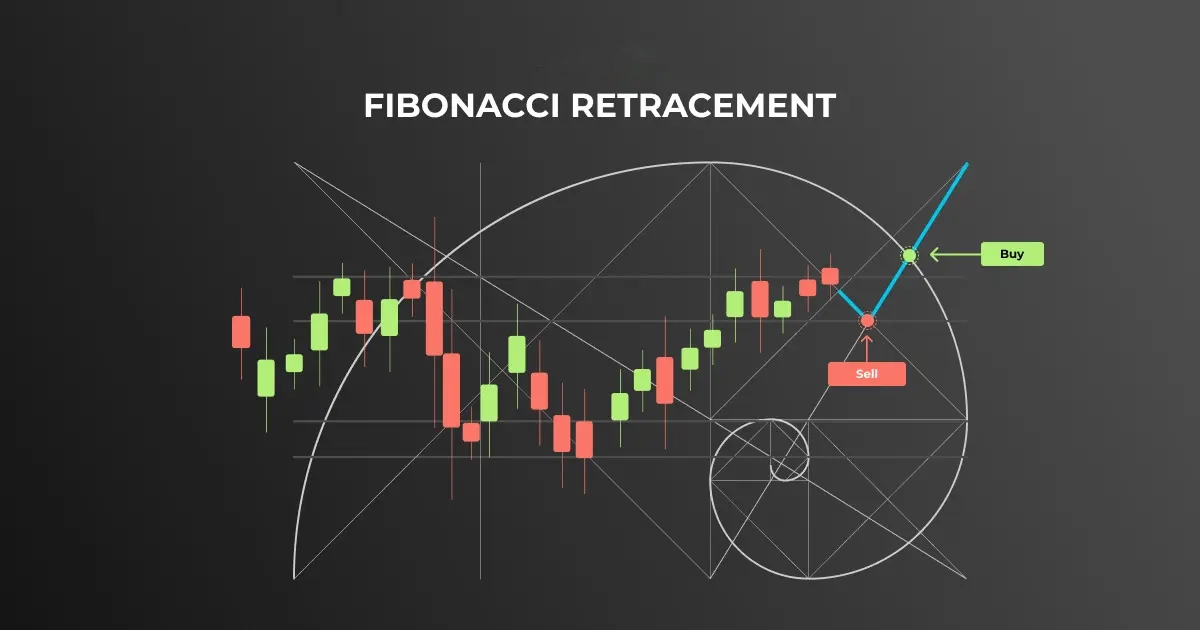
Choosing the correct swing high and swing low matters. Beginners often draw Fibonacci retracements from random points until the chart looks convincing. That creates false confidence. Use obvious major highs and lows that other traders can see.
Fibonacci can help with planning. Traders may use retracement zones for entries, invalidation, or partial profit areas. For example, in an uptrend, a pullback into the 50% zone with bullish structure may offer a better risk-reward than buying the top.
However, crypto volatility means levels can overshoot. Price may wick through a Fib level and still recover. That is why stops should be placed where the trade idea is invalidated, not exactly on the Fib line.

Free Crypto Signals Channel
 Free Telegram Channel
Key takeaway:
Fibonacci retracements are useful for mapping pullbacks, but they are strongest when they align with support, resistance, volume, and trend structure.
Educational content only. Not financial advice. DYOR.