Binance Coin (BNB) Breaches the $600 Overhead Resistance, Poises for Upside Momentum
Estimated Reading Time: 2 minutes
Don’t invest unless you’re prepared to lose all the money you invest. This is a high-risk investment and you are unlikely to be protected if something goes wrong. Take 2 minutes to learn more

Binance Coin (BNB) Long-Term Analysis: Bullish
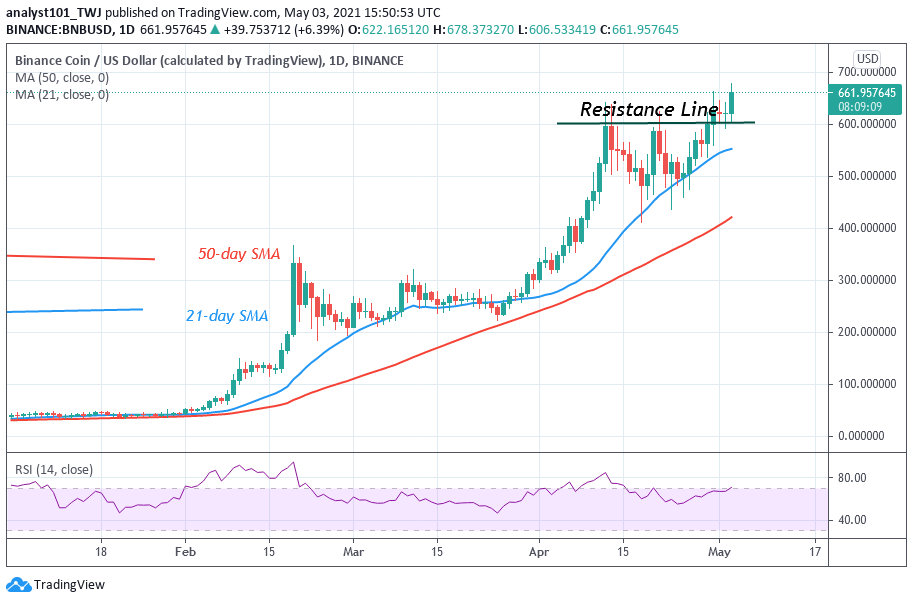
Binance Coin price has resumed an upward move after breaking the resistance at $600. Before the recent breakout, the price action has formed a bearish triple top. The breakout canceled the bearish pattern that was earlier formed. The current uptrend is likely to continue as price breaks and closes above the resistance line.
Binance Coin (BNB) Indicator Analysis
The crypto’s price has broken and closed above the resistance line. Also, the BNB price is above the 21-day SMA and 50-day SMA which suggests that there is a likelihood of upward movement of prices. BNB has risen to level 67 of the Relative Strength Index period 14. It indicates that the altcoin is in the uptrend zone and it is approaching the overbought region.
Technical indicators:
Major Resistance Levels – $640, $660, $680
Major Support Levels – $540, $520, $500
What Is the Next Direction for Binance Coin (BNB)?
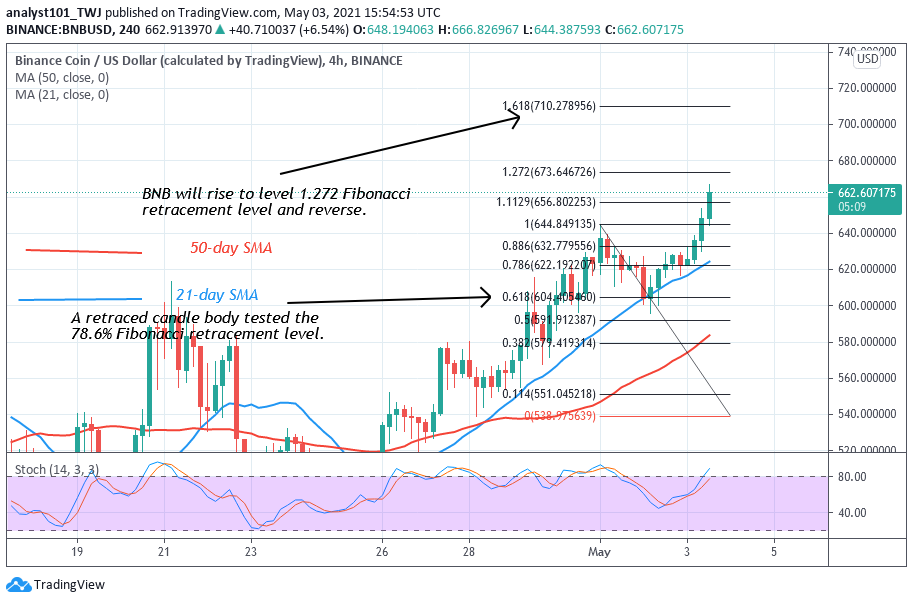
Binance Coin has resumed the uptrend. There is a possibility of further upside momentum. On May 1 uptrend, a retraced candle body tested the 61.8 Fibonacci retracement level. The retracement indicates that the market will rise to level 1.618 Fibonacci extension or the high of $710.27. From the price action, the market has risen to a high of $662 at the time of writing.
Note: cryptosignals.org is not a financial advisor. Do your research before investing your funds in any financial asset or presented product or event. We are not responsible for your investing results