BNB Pauses Above S220 As It Maintains Its Range-bound Move
Estimated Reading Time: 2 minutes
Don’t invest unless you’re prepared to lose all the money you invest. This is a high-risk investment and you are unlikely to be protected if something goes wrong. Take 2 minutes to learn more

BNB (BNB) Long-Term Analysis: Bullish
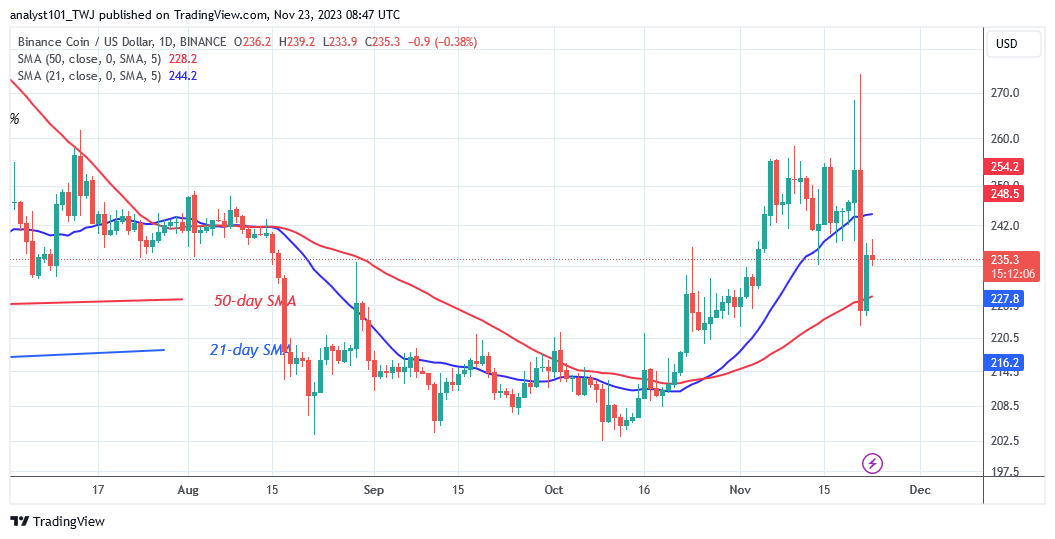
The price of BNB (BNB) is falling below the moving average lines as it maintains its range-bound move. The crypto was trading sideways beneath the resistance level at $260 before the most recent decline. The cryptocurrency is correcting upward, but it is caught between the moving average lines. The upward correction has come to a halt just below the resistance level of $240.
In that event, BNB/USD may continue its downward trend. The altcoin is currently dropping towards the 50-day moving average ($MA). If the altcoin falls below the 50-day SMA, it will revert to the prior range bound zone of $203 to $220. On the upside, future price increases are met with resistance at the $240 and $260 price levels.
Technical indicators:
Major Resistance Levels – $440, $460, $480
Major Support Levels – $240, $220, $200
BNB (BNB) Indicator Analysis
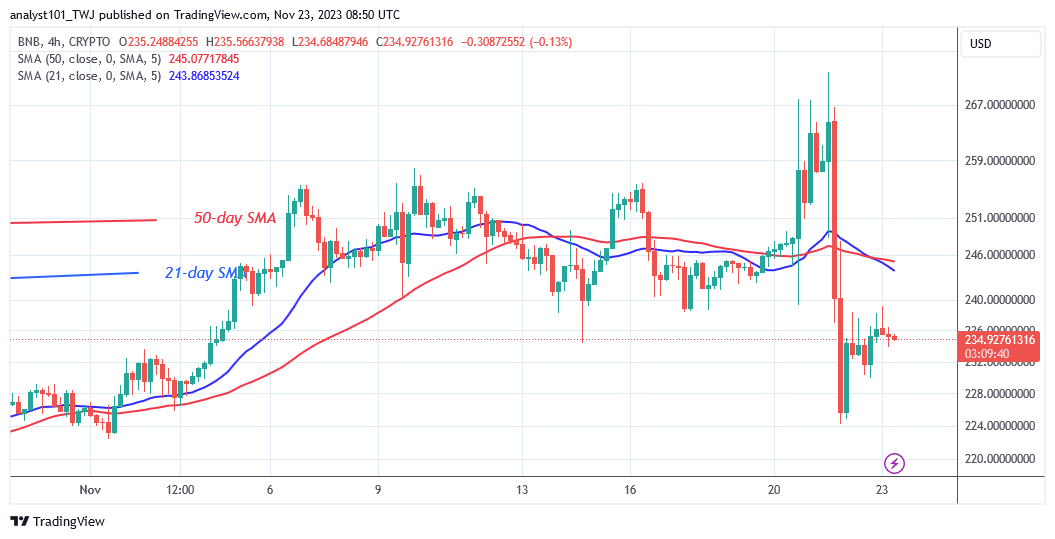
The price bars have been caught between the moving average lines for the past two days. The price bars had broken through the moving average lines before they were trapped. Since November 6, when the uptrend ended, the lines representing the moving averages have remained horizontally flat.
What Is the Next Direction for BNB (BNB)?
Binance Coin falls after the upswing reaches an end as it maintains its range-bound move. The altcoin recovered above the important support level of $220. If the current support holds, the upward trend will resume. On the downside, if BNB loses its present support near $220, it will revert to its former range.
You can purchase crypto coins here. Buy LBLOCK
Note: Cryptosignals.org is not a financial advisor. Do your research before investing your funds in any financial asset or presented product or event. We are not responsible for your investing results