BNB Retraces but Remains above the $260 Breakthrough Level
Estimated Reading Time: 2 minutes
Don’t invest unless you’re prepared to lose all the money you invest. This is a high-risk investment and you are unlikely to be protected if something goes wrong. Take 2 minutes to learn more
BNB (BNB) Long-Term Analysis: Bullish
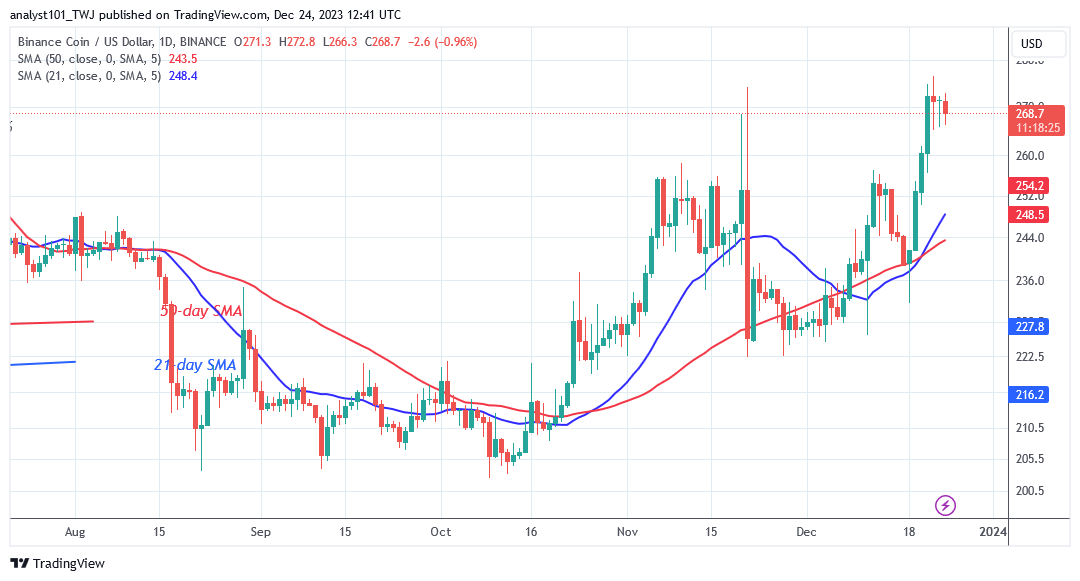
The BNB (BNB) price is trading in the bullish trend zone as it remains above the $260 breakthrough level. The bullish momentum was maintained as it broke above the $260 resistance mark. On December 21, the altcoin reached a high of $274. The bullish momentum has come to a halt near the current high. The altcoin is currently trading below the $272 high.
On the upside, if bulls break through the $272 resistance level, BNB will reach its prior high of $335. Meanwhile, if bulls fail to break through the recent high, the coin will be forced to trade sideways below the barrier level. The BNB/USD rate is $269.50 at the time of writing.
Technical indicators:
Major Resistance Levels – $440, $460, $480
Major Support Levels – $240, $220, $200
BNB (BNB) Indicator Analysis
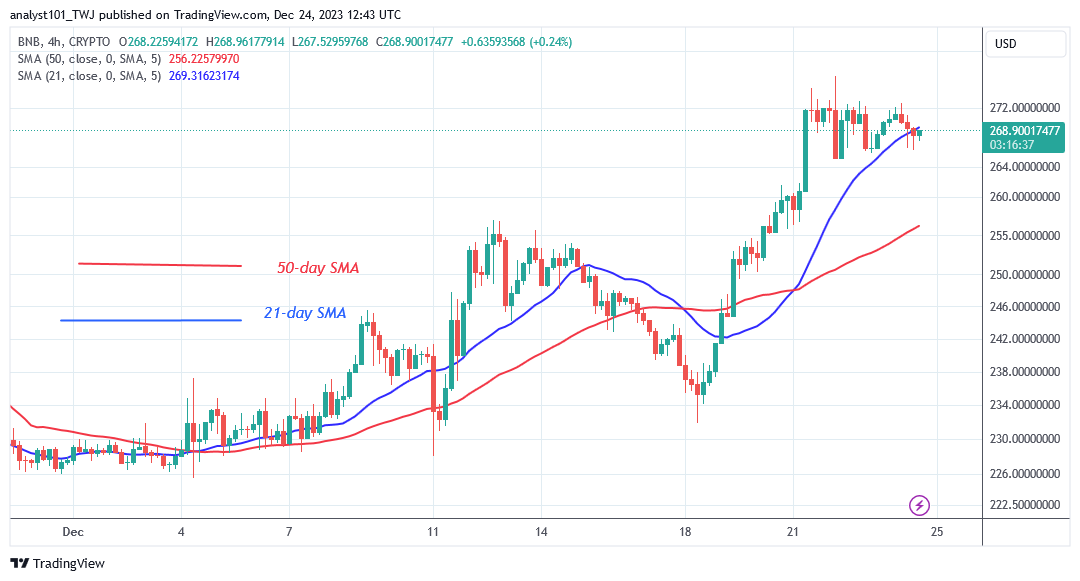
Price bars are well above the moving average lines following the recent surge. The price bars on the 4-hour chart are stabilizing above the 21-day SMA. BNB has a bullish crossing, which occurs when the 21-day simple moving average crosses above the 50-day simple moving average, signaling a bullish order.
What Is the Next Direction for BNB (BNB)?
Binance Coin has regained bullish momentum as it remains above the $260 breakthrough level. The current bullish momentum has stopped at the recent high. Presently, the altcoin is fluctuating between levels $264 and $272 price levels. The altcoin can trend as it is in a tight range. On the 4-hour chart, the bears are attempting to break below the 21-day SMA.
You can purchase crypto coins here. Buy LBLOCK
Note: Cryptosignals.org is not a financial advisor. Do your research before investing your funds in any financial asset or presented product or event. We are not responsible for your investing results